Developing Countries Trade with Canada: Gains from Unilateral Tariff Reform

[vc_row][vc_column width=”9/12″][vc_column_text]by Aniket Bhushan

Published: April 23, 2016

Canada prides itself on being open to foreign trade. Canada’s trade to GDP ratio is around 63% making it one of the more open economies in the world. Canada accounts for approx. 2.5% of global exports and imports.

Trade is an import element in Canadian development strategy. This is especially the case since the amalgamation of the former autonomous aid agency into the foreign affairs and trade ministry.

Canada provides generous access to developing countries through preferential trade agreements, FTAs and FIPAs, specific market access initiatives and through ‘aid for trade’ (A4T) initiatives.

Some of the most important Canadian initiatives aimed at developing countries include: the General Preferential Tariff (1974, updated in 2014), the Least Developed Country Tariff (LDCT 2003) and Canadian Market Access Initiative for Least Developed Countries (2003), and the Commonwealth Caribbean Countries Tariff (CCCT 1986).

Unilateral import tariff reform and reduction

As discussed in the lead up to the recent budget, there is considerable scope for unilateral tariff reform, reduction and elimination as Canada’s import tariff system is excessively complicated, costs the private sector billions, lowers productivity and does not produce enough government revenue to justify it. These arguments are most effectively put forward by Mike Moffat, who makes a strong case for unilateral tariff elimination, here and here.

Only a handful of products account for the vast majority of import tariffs (or duties) collected by Canada. Because these include the few product areas in which developing countries are competitive in the Canadian import market, we decided to complement the analysis by looking at it from a development perspective.

How much does Canada collect in import duties and tariffs; on what and from who?

Canada collects approx. CAD$4 billion in import duties and tariffs a year. It is worth remembering even though Canada has ‘free trade’ with several countries this does not mean import duty and tariffs collected are necessarily zero. For e.g. Canada has free-trade with the US, despite this the US is the second largest country in terms of import duty collection. However, the rate of collection is very low – import duty accounts for only 0.2% of the total value of goods imported into Canada from the US.

While there are a number of product areas with quite specific tariffs – at least 94 product groups at the HS 2 level, the Customs Tariff schedule is a 1569 page document with well over 15,000 tariff items – only 10 product areas account for the vast majority of tariffs collected. The top 10 product areas, visualized below, account for $6.4 billion out of the approx. $8.4 billion in import tariffs collected in the two years analyzed.

The single biggest individual product area is motor vehicle imports, however, the biggest product area combining closely related groups is apparels, clothing and textiles, accounting for $2.6 billion in tariffs collected (2012 and 2013). Developing countries dominate the Canadian import market for apparels. The other two products where significant import tariffs are collected and where developing countries are competitive are footwear and furniture.

overall duty collected

China accounts for the largest share of import duty collection. In fact approx. 41% or $3.4 billion out of $8.4 billion of Canadian import tariffs are collected from China. Other developing countries whose imports contribute significantly to Canada’s import tariffs include: Vietnam, India, Indonesia and Thailand. Some of these, and other development partner and priority countries are analyzed in more detail.

Is policy coherent? Trade, aid, development and tariffs

In order to assess whether policy is coherent or not we need to deepen the analysis. The three data points and key take-aways, below, help to do this.

The 13 developing countries below account for over 52% of import tariffs collected by Canada. They are selected purely for illustration, however, each falls under the category of being a “development focus” or “development partner” country based on Global Affair’s priority countries lists for Canadian aid and development. Or as a “priority market” in the Global Market Action Plan. Even though lists may well change, there is a good chance many of these countries will remain important for Canada.

These are countries where Canada is engaged in supporting development, and or trade and trade-related development agendas.

Key take-away 1: Many priority developing countries are over-represented in duty collection, relative to their share in Canadian imports

The table below compares the share imports from each country into Canada make up as a percentage of total imports into Canada, against the share of duty collected on the imports of each country relative to total duty collected.

Vietnam which accounts for less than half a percent of Canadian imports, accounts for around 3.6% of total duty collected; Indonesia which accounts for around 0.3% of imports, accounts for 1.7% of duty collected; India which accounts for 0.6% of imports, accounts for 2.5% of duty collected; China – the big outlier – accounts for around 11% of imports, but over 40% of duty collected. This is not universal. Brazil for e.g. accounts for a lower share of duty collected than its share of imports.

share of import and duty

Key take-away 2: Duty collected as a share of imports are higher in the case of most developing countries than the Canadian average

The figure below computes duty collected as a share of each country’s imports into Canada. This gives us a sense of a real cost of accessing the Canadian market.

On average duty collected accounts for just under 1% of the value of imports into Canada. However in the case of many developing countries, all but Brazil below, the ratio is far higher. In some cases the high ratio will be explained by the low level of imports (i.e. smaller denominator) e.g. Haiti, to a lesser extent Honduras, Pakistan and Sri Lanka. In other cases such as Vietnam, Indonesia, China and India – their imports face duty levels that are 3 to 7 times the average. Duty collected is about 7% of the value of total imports into Canada from Vietnam for instance (for comparison, recall, the ratio is about 0.2% in the case of the US).

duty share of imports

Key take-away 3: In many cases duty collected exceeds or rivals all aid given by Canada to the same countries

Of the 9 development partner and priority countries below, in 4 cases the level of duty collected is higher than all aid disbursed: Vietnam, Indonesia, Philippines and Sri Lanka. In 3 other countries duty collected is significant relative to aid given: Honduras, Guatemala and Pakistan.

In other words, what Canada collects from these countries in the form of tariffs on their imports either exceeds or rivals all the aid we give the same countries.

An even greater irony is that in many cases, including but not limited to Haiti, Honduras, Indonesia, Philippines, Vietnam, Guatemala and Sri Lanka, part of the objective of Canadian aid is to support poverty reduction through trade; the so called aid for trade agenda. According to the OECD, Canada provides Haiti, Vietnam and Indonesia between $10 and $20 million in A4T support a year (higher in previous years).

duty vs aid

A reasonable conclusion one can draw from the perspective of pursuing dual trade and development objectives is that policy is not as coherent as it could be.

What criteria for reform and what reform?

The actual costs of import tariffs and duties are likely a lot higher as there are indirect compliance costs that are hard to estimate especially in the case of developing countries.

A simple criteria for reform could be two fold:

Strategic imperative: where the strategic imperative is not strong or clear,  tariffs could be candidates for unilateral elimination or other reform. A strategic imperative for example could be negotiating leverage in future trade negotiations. Or specific (allowable) sector protections to safeguard Canadian domestic supply.

Revenue imperative: where the revenue imperative is not strong or clear,  tariffs could be candidates for unilateral elimination or other reform. If revenue collection is not significant (which is in most cases given tariffs make up a small share of Canadian revenue) they could be reduced, or eliminated. If the cost of removal is not high they could be candidates for removal. There could be additional savings in the form of reduced costs for the expensive trade tribunal infrastructure that supports (relatively obscure) cases and regulations, and costs the taxpayer about $10 million a year.

Reform options could be placed on a spectrum – from unilateral elimination to partial/phased reduction to creative utilization of funds to support market access and trade capacity development. The other end of the spectrum, which is always an option, is continued incoherence.

Who may gain from reform, how and how much?

Gains from unilateral tariff elimination extend from developing countries, to Canadian business and ultimately to consumers.

Developing countries would gain directly, monetarily, the amount that is otherwise lost to tariffs (all things being equal) if these tariffs are eliminated. For the countries above that would equate over $4 billion per year, driven primarily by China. Gains could also come in other forms such as new opportunities and business linkages.

Many of the product areas where developing countries could gain are very low margin – apparel, footwear, and many segments of furniture. So even small changes could have an impact on final margins, profitability, and partnership opportunities with Canadian firms.

Canadian business (importers) would also gain from lower costs, including lower compliance costs. Selective lowering or cuts could help provide incentive for new partnerships with suppliers.

Ultimately the consumer would gain from lower cost of imports. Mexican beer would be made cheaper, as could mattresses and furniture. It is worth noting that such tariff elimination has been proposed, and practiced, in the past including as a form of economic stimulus.


About the data used in this analysis

The data are for 2012 and 2013 (the latest complete years available). The data were sourced from Statistics Canada (via the University of Toronto) at HS 10 level. They were merged with our trade data system, aggregated up to the HS 2 level, joined with country characteristics and classifications, and other data points such as aid data.[/vc_column_text][/vc_column][vc_column width=”3/12″][vc_widget_sidebar sidebar_id=”rightsidebar”][/vc_column][/vc_row][vc_row][vc_column width=”1/1″][themeone_spacer height=”20px”][/vc_column][/vc_row]

Canada and the OECD-DAC aid statistics – 2015

[vc_row][vc_column width=”1/1″][themeone_header type=”h3″ txtalign=”txt-left” decor=”” decorheight=”2px”]

Quick overview of recently released comparative aid statistics from the OECD-DAC for 2015. Click on images below to see full page view.

[/themeone_header][/vc_column][/vc_row][vc_row][vc_column width=”1/2″][themeone_spacer height=”20px”][themeone_header type=”h3″ txtalign=”txt-left” decor=”” decorheight=”2px”]

Comparative ODA and ODA/GNI levels

[/themeone_header][vc_column_text]

ODAgni comps

[/vc_column_text][themeone_spacer height=”20px”][/vc_column][vc_column width=”1/2″][themeone_spacer height=”20px”][themeone_header type=”h3″ txtalign=”txt-left” decor=”” decorheight=”2px”]

Key year-on-year changes

[/themeone_header][vc_column_text]

yr on yr change

[/vc_column_text][themeone_spacer height=”20px”][/vc_column][/vc_row][vc_row][vc_column width=”9/12″][vc_row_inner][vc_column_inner width=”1/2″][themeone_header type=”h3″ txtalign=”txt-left” decor=”” decorheight=”2px”]

About

[/themeone_header][vc_column_text]Total net ODA from OECD-DAC countries reached US$ 131.6 billion in 2015, in current US$ terms. However net ODA reached US$ 146.6 billion, at 2014 prices and exchange rates.

According to the OECD-DAC, “ODA is up 83%  [in real terms] since 2000, when the Millennium Development Goals were agreed”.[/vc_column_text][themeone_header type=”h3″ txtalign=”txt-left” decor=”” decorheight=”2px”]

Story behind the numbers

[/themeone_header][vc_column_text]The OECD-DAC numbers, while official and high quality, can be challenging to interpret. Two pieces of the puzzle are critical to understand in order to interpret the most recent data i.e. for 2015, appropriately:

  1. Currencies: movements in exchange rates are a huge part of the story this time around. This is because most of the 28 OECD-DAC countries saw their exchange rates depreciate substantially against the US$. Adjusting for this effect (and inflation) as the DAC does in calculating ‘real change’ indicates net ODA increased by around $9.4 billion or around 7%. If we do not adjust for this and instead treat all DAC countries ODA in current US$ terms, net ODA actually fell by -$5.6 billion.
  2. Refugees: as mentioned above, the data indicate an increase in net ODA in real terms of approx. 7% 2015 compared to 2014. However, during this period in-donor refugee costs doubled. This is money spent inside donor countries on the costs of settling refugees, but according to DAC rules is allowed to be reported as ‘foreign aid’ (to a large extent the accounting is up to donor discretion). If we strip out in-donor refugee costs, net ODA only rose 1.66%, i.e. far lower than the reported 7% increase. This means a large share (approx. 70%) if the increase in net ODA is due to in-donor refugee costs which have spiked as more and more people seek refuge from conflicts like (but not limited to) Syria, especially in Europe.

Refugee costs and key European donors 

It bears repeating just how much refugee costs are impacting ODA numbers.

Take for instance Sweden, Germany and Netherlands. The DAC reports increases in ODA for each respectively of 36.8%, 25.9% and 24.4%. If we strip out in-donor refugee costs however, these increases fall substantially – to 9.8%, 5.8% and 15.4% respectively. In other words the sharp increase in ODA is driven by the dramatic rise in refugee costs.

Even more extreme examples are Austria and Denmark – ODA has reported to have increased by approx. 15% and 1% respectively. Strip out refugee costs, ODA fell, substantially, approx. 7% in each case.[/vc_column_text][themeone_spacer height=”20px”][themeone_header type=”h3″ txtalign=”txt-left” decor=”” decorheight=”2px”]

About the data and source

[/themeone_header][vc_column_text]For more, please visit the OECD-DAC aid statistics page. See also, the DAC’s narrative summary. And detailed data (pdf).

Download our clean, summary version of the data used above. (MSExcel)[/vc_column_text][/vc_column_inner][vc_column_inner width=”1/2″][themeone_header type=”h3″ txtalign=”txt-left” decor=”” decorheight=”2px”]

Canada in the OECD-DAC (preliminary)

[/themeone_header][vc_column_text]The main objective of this quick preliminary analysis is to reflect on the data from the perspective of where Canada stands relative to OECD-DAC donors.

  • Canada’s aid totaled approx. US$ 4.9 billion in 2015, if viewed in 2014 prices and exchange rates (again, as the DAC does to calculate real rates of change)
  • This compares with approx. US$ 4.2 billion in 2014
  • Canada’s ODA, in real terms, increased a whopping 17%, 2015 vs 2014 – making it one of the largest increases among larger DAC donors
  • Canada’s ODA/gross national income (GNI) ratio now stands at 0.28% — a jump up from 0.24% in 2014 (which was a historical low on the backs of sharp cuts of approx. -11% in both 2014 and 2013)
  • By comparison Canada’s aid in 2012 totaled US$ 5.6 billion
  • In volume terms Canada now ranks the 9th largest OECD-DAC donor – Canada’s rank has moved up one place
  • By comparison, in 2012 Canada ranked the 6th largest OECD-DAC donor, in 2013 Canada ranked 9th, in 2014 Canada’s rank fell to 10th
  • In terms of the ODA/GNI (or generosity ratio) Canada’s ratio, at 0.28% is now very close to the OECD-DAC average of approx. 0.3% – and has moved up significantly from Canada’s 2014 level at 0.24% of GNI which was far below the total OECD-DAC level at 0.29%
  • Based on the ODA/GNI ratio Canada now ranks 14th among the 28 DAC members, up from 16th in 2014; and back to the level it was  in 2012 and 2013

This is a preliminary analysis of headline figures which provide only a partial sense of Canada’s wider contribution to international development.

The story – and CAD$800 million+ problem – behind Canada’s numbers

Headline figures taken at face value are highly misleading especially if viewed as a reversal of recent (downward) trends, at least in Canadian ODA. While refugee costs are a major explanatory factor especially for most large European donors. They are not a factor (at least not yet i.e. not in this reporting cycle) for Canada.

However there are two other important issues in this particular reporting cycle.

From Canadian data – released back in December 2015 and updated again in March 2016 – we know there are exceptional items in this particular year.

  • The first is an exceptional double payment to the World Bank (International Development Association or IDA) which is essentially a one-time administrative issue. This however accounts for approx. CAD$441 million of reported ODA.
  • The second – less clear from DAC data or analysis – comprises two loans made to Ukraine totaling CAD$400 million. This actually makes Ukraine, by far, Canada’s largest aid recipient, as the loans seem to have been booked entirely as ODA.

Together these account for a CAD$800 million+ one time anomaly in reported Canadian ODA.

While there is not a one to one relationship between Canadian and DAC data (due to currency and fiscal vs. calendar year normalization), one can safely conclude that if the impact of these one-time entries is stripped out or somehow smoothed, Canada’s ODA declined, not increased (as suggested by the DAC and discussed above). Indeed, stripping these payments out would show that Canada’s ODA/GNI ratio declined further.

These findings, while not without problems, nevertheless represent a serious challenge to the integrity of the DAC’s data.[/vc_column_text][/vc_column_inner][/vc_row_inner][/vc_column][vc_column width=”3/12″][vc_widget_sidebar sidebar_id=”rightsidebar”][/vc_column][/vc_row]

Canada’s Foreign Aid

[vc_row][vc_column][themeone_header type=”h3″]

The dashboard below provides data and analysis on Canada’s international assistance.

[/themeone_header][/vc_column][/vc_row][vc_row el_class=”primary_viz_container”][vc_column][vc_column_text]

[/vc_column_text][themeone_spacer height=”20px”][/vc_column][/vc_row][vc_row][vc_column width=”9/12″][vc_row_inner][vc_column_inner width=”1/2″][themeone_header type=”h3″]

International Assistance Spending

[/themeone_header][vc_column_text]Canada’s international assistance spending increased by 27.0% to CAD$8.4 billion in 2021, up from CAD$6.6 billion in 2020.

International assistance accounts for approx. 1.6% of 2021 federal budget spending  – significantly up from last years 1.0% budget expenditure in 2020. This rise, however, is largely explained by the dramatic drop in budget expenditures compared to the previous year.

In 2021, Canada’s ODA/gross national income (GNI) ratio stood at 0.31% — up from 2020 (0.27%).

Who are the largest recipients?

The largest recipient in 2021 was Afghanistan (CAD$178 million), followed by Ethiopia (CAD$140 million), Lebanon (CAD$123million), South Sudan (CAD$115 million), and Mali (CAD$109 million).

Where were the sharpest increases and declines?

The most notable changes in year-over-year international assistance levels were to: Lebanon(+39%), DRC(-55%), Kenya(-57%), Bangladesh (-36%), and Nigeria (-42%). Lebanon received the largest year-over-year dollar increase; up CAD$34.3 million from last year.

Income Groups and Regions

18.7% of aid went to Least Developed (or poorest) Countries, another 0.8% went to Other Low Income Countries, and 8.3% went to Lower Middle Income countries (67.6% is not coded by income group).

African countries received the largest regional share of Canada’s international assistance at 33.3%, followed by Asia & Middle East(22.0%), the Americas (12.9%), Europe (1.9%), and Oceania (1.1%). This is only international assistance that has been coded to a region (90.1% of total).

Departmental and Government channels

The amalgamation of the former aid agency CIDA into foreign affairs, and re-branding as Global Affairs Canada (GAC), continues to complicate the departmental sources and channels picture. Typically about 65% to 75% of aid was channeled through (former) CIDA.

Most of this has now transitioned to GAC consolidated. Which means it is not possible to easily distinguish (former) CIDA from (former) DFAIT assistance.

The more relevant distinction is whether the financing is from the international assistance envelope (IAE) or non-IAE. The IAE accounts for the vast majority, 91%, or CAD$7.7 billion in 2021. Non-IAE channels are 9% (or CAD$0.8 billion) and comprise items such as the cost of settling refugees.

The three major IAE channels are GAC (90.9%), Finance (6.7%), and IDRC (2.0%).[/vc_column_text][/vc_column_inner][vc_column_inner width=”1/2″][themeone_header type=”h3″]

Using the Data

[/themeone_header][vc_column_text]Hover over country circles on the map to see how much went to which countries. Circles are sized to reflect the amount of Canadian aid the country receives (in the selected year, by default most recent).

Clicking on a country will reveal links that can be clicked for more details. Doing so will switch the view to the details table, where further selections can be made.

Use drop-downs to limit the data by “region”, “income level” or change “year”; by “bilateral vs. multilateral”, “departmental sources, or specific initiatives (where relevant)”.

Multiple countries can be selected at one time for comparison (no more than two at a time are recommended). Hold down Control + right click. Click again to deselect. Refresh browser or click “Reset” at the bottom of the dashboard to reset the view. At any point, to go back, click “Undo” at the bottom of the dashboard.[/vc_column_text][themeone_header type=”h3″]

Methodology

[/themeone_header][vc_column_text]Data is sourced from CIDA Statistical Report on International Assistance for reporting years prior to 2017 and the Historical Projects Data Set for reporting years including and after 2017. After 2017, international assistance spending was included in the Historical Projects Data Set, but not applied retroactively to other HPDS years. We have merged these datasets, where possible, to give a coherent time series for the reporting above. The MS Excel version of this data can be downloaded below.

OECD-DAC country, regional and income classification coding is also applied.

Data is reported on “gross” basis (i.e. loan repayments, which entail negative transactions, are excluded). In order to simplify interpretation calendar years are used, but the data is on a fiscal year basis (i.e. 2001 is 2000-01 and so on).

There may be slight differences between this data and data from the OECD-DAC. This is for two reasons: fiscal year (as opposed to calendar year) is used here, and Canadian dollar (as opposed to US dollar) is the currency unit.

Note: this data was last updated in March 2021. Data can be freely extracted from the above dashboard using the “download” options.

Updated raw data are provided below, in detail, by country/region/income group/source/channel, on gross basis, in CAD$, on fiscal year basis.

Aid (2020) web-version (MS Excel)[/vc_column_text][themeone_header type=”h3″]

Contact

[/themeone_header][vc_column_text]This data is part of ongoing research at the Canadian International Development Platform. For more information please contact: aniket.bhusan@carleton.ca[/vc_column_text][/vc_column_inner][/vc_row_inner][/vc_column][vc_column width=”3/12″][vc_widget_sidebar sidebar_id=”rightsidebar”][/vc_column][/vc_row]

Did Budget 2016 Deliver: A Follow-up Checklist

[vc_row][vc_column width=”9/12″][vc_column_text]by Aniket Bhushan

Published: March 23, 2016

In the lead-up to Budget 2016 we put forward two analyses that set out our watch-list:

High level areas (tone and narrative)

Specifics on global affairs, development and trade

It is time to update and score our checklist. At the outset we should note that in no way is this scientific, comprehensive or conclusive – but neither frankly was the budget. Details of what we scored and how are below, and should be interpreted with reference to the two links above. But the summary is as follows (click images below to expand):

On high-level points – tone, narrative, vision we get a score of 70% (3.5/5) 

The budget buys the government more time and space, it sets up to win/outperform if things improve faster than expected due to external factors beyond control, it succeeds in coming across as middle class and human-centered, and over-weights necessary social infrastructure investment be it in first nations, child care, climate, research and scientific infrastructure; but it is unlikely to stimulate at least not in the short term, and takes a wait and see approach in several key areas.

On global affairs, development and trade, (being generous) we get a score of 65% (6.5/10)

The budget gives ample room to “Canada in the World“; announces a modest increase over the next two years in the International Assistance Envelope (the main source of Canadian ODA spending) of $256mn over the next two years and more importantly aims to take it over $5 billion by 2018-19 (ex exceptional items it is roughly $4.4 billion at the moment), which shows intent even in tough times, buys more time for a policy review and consultations (till budget 2017); but with the exception of modest efforts on unilateral tariff reform (which could have an impact on developing country market access and competitiveness), (hints at ‘deepening trade with China and India’), and investments in needed improvement in open data – there are no surprises. It gets (partial) points for refugee intake, support for humanitarian efforts in the region, climate finance in developing countries – but none of this is new or unknown. It makes no reference to Canadian leadership on MNCH or the way forward on supporting reproductive health, or innovation in development finance, engaging the private sector in development both Canadian and in developing countries, or other non-traditional partners.

High level areas – tone, narrative, vision 

budget1

Global affairs, development and trade 

budget2

budget3[/vc_column_text][/vc_column][vc_column width=”3/12″][vc_widget_sidebar sidebar_id=”rightsidebar”][/vc_column][/vc_row][vc_row][vc_column width=”1/1″][themeone_spacer height=”20px”][/vc_column][/vc_row]

Budget 2016: Canada is back on the global stage

[vc_row][vc_column width=”9/12″][vc_column_text]by Aniket Bhushan

Published: March 22, 2016

The lead-up discussion and the budget itself, understandably, focuses on domestic tax and spend issues. Global aspects have received less attention.

In two posts we look at: specifics we will be watching for on global affairs, trade and development spending (here below); and high level areas that should be kept in view to interpret the budget (here).

Canada is back on the global stage

The key message of the new government since election, and earlier in the platform, is that Canada is back on the global stage. While clearly the budget largely focuses on domestic issues, it is inevitably also a first real test for the ‘how’ in Canada getting back on the global stage. Below are some areas that may be worth looking at to assess how far this budget goes.

Global affairs and development spending

How and how much does it talk about Global Affairs (if at all)? Does the budget reference foreign aid, international development or international assistance, and spending related to the same, explicitly (which some of the past budgets have specifically avoided)?

With the amalgamation and more recent re-branding of foreign affairs in Canada it is worth looking at how and how much the budget talks about the new department. Past austerity budgets have brought spending freezes and cuts. So will this deficit spending budget bring the opposite? Past budgets have brought institutional changes (amalgamation of development), will this one plan or portend a reversal – which would be a huge surprise.

According to our analysis, based on Public Accounts data, on an amalgamated basis (foreign affairs, trade and development combined), we are spending about 8 to 10% less now on global affairs than we did 5 years ago (approx. $6.5 billion in 2010-11 vs. under $6 billion in 2014-15). Spending on global poverty reduction and sustainable development are also lower (by around 12% compared with 2011-12). Canada’s development spending is at historically low levels.

At some stage the ‘Canada is back on the global stage’ message will be expected to be backed up by dollars – will this budget head in that direction?

Any reference to 0.7% of GNI aid levels or 0.15-0.2% GNI aid target for the poorest and fragile states (recently adopted by the UN) – would be a shocker. Modest reference to maintaining spending at current budget/expenditure levels would be a positive surprise especially as it will mean increases (as the denominator grows).

Interpreting recent figures (Dec 2015, as part of the ODA Accountability Act reporting) as reversal in spending levels would be misleading – sure there is an increase, but it is driven entirely by an exceptional payment to the World Bank and a couple of loans to Ukraine – which the report to its credit makes clear. The core of development spending from the department is otherwise flat (or down slightly).

Areas to watch go beyond spending levels however. Could the budget indicate a formal global affairs review (development and trade policy review?) or moves towards a new international policy statement? These would be welcome low cost surprises.

Going further on MNCH – reproductive health

One of the main, and indeed few, areas that the Liberal platform was specific on as it relates to development was the addition of reproductive health to MNCH spending and a continuation of MNCH priorities.

So far we have seen little more than restatement and repackaging of funding we already knew about. Will the budget go any further, for instance by elaborating on how aid and development finance allocation strategies may change?

Multilateralism, SDGs, Agenda 2030

We know that Canada plans to contest a UN security council seat in 2020. We know that this government plans to take the SDGs, including what they imply domestically, more seriously. But how will that translate in practice? Any explicit reference to SDGs and Agenda 2030 – for instance to justify increased spending globally even if only over the medium to longer term – would be a surprise. What other forms could ‘multilateralism’ take?

Reference to Global Fund replenishment – unless they come in at a higher than expected level – would not really be a surprise, seeing as Canada is an important contributor from the start.

Refugees and immigration

The 25th thousandth Syrian refugees arrived in Canada to much deserved national pride and fanfare. We know from the Feb update that the Syrian refugee resettlement will cost around $700 million out to 2017-18. Will the budget say anything further, either on refugee settlement and immigration numbers and targets, or costs?

Syria, and regional contribution

While Canada’s London conference pledge, if any, is hard to decipher, we know, from the Feb update, the ‘Whole-of-government strategy in Iraq, Syria, Jordan and Lebanon’ – i.e. assistance in the region – is placed at another $1 billion. Will there be anything further on regional response or humanitarian contribution?

Climate change and climate finance

Canada had a strong showing with a large delegation at COP 21 in Paris. Canada played an important and constructive role in the outcome. But the follow-through on actions at home on a whole-is-bigger-than-sum-of-parts national plan (as opposed to different provincial plans) is more elusive. Any indication of this, or incentives in the direction, in the budget would be an important sign.

Canada has also recommitted support to climate finance in developing countries – but will the budget go any further, either explicitly or by linking the same to promoting clean tech investment, knowledge transfer or other forms of cooperation?

Innovative finance and the DFI

The last budget announced a new development finance initiative ($300 million over 5 years) housed at EDC – will this one follow up on the same or update?

Additional funding for Grand Challenge Canada – a challenge fund which is part of the innovation arm of development finance – would not be a surprise (it was also in the last budget). Repeat references to blended finance initiatives like Convergence (or for that matter the Global Financing Facility for Women and Children which we know Canada is contributing to) would show things are still being figured out and not quite ready for any major announcement on innovative finance, or engaging the private sector.

Trade agenda

Most will view trade from the perspective of headline issues. The TPP seems to be in some trouble (in the US) – will there be an update on it? The conclusion of CETA as a ‘gold standard’ trade agreement has already been celebrated. Could there be anything further on the trade agenda?

Past budgets have referenced trade, for instance in the form of changes to the GPT preferential trade regime and in the form of removal of tariffs as part of economic stimulus (Budget 2013).

Here is a great idea that is doing the rounds (and wont make the budget) – unilateral reduction of complicated tariffs that contribute little by way of revenue and are of little importance as strategic leverage in future trade negotiations.

This could have a big impact including from a development perspective because at least two out of the three main areas where the bulk of the $4 billion in import tariffs are collected are clothing and shoes – both products where developing countries already have substantial market share and could benefit greatly from more liberalized and better market access.

Open data and the evidence base

The new government has raised expectations in terms of transparency and accountability. It has also claimed one of the ways it will do things differently is by being more evidenced based. Further investing in the open data ecosystem in Canada is key.

While we have a lot of data – too much in fact – and data.gc.ca has made a lot of progress in pushing data out, we are a long way from it being facilitated in the most effective way. In many areas we have overlapping data that make more sense to take the effort to consolidate than share disparately (migration data is a great and frustrating example). In other areas while there is a lot of reporting the data coverage and gaps make it poor (FDI is a great example). In yet other areas while we have good data on some aspects (financials) we have little on others (results and outcomes) as we have seen in the case of MNCH development spending data, less than 50% of which according to our analysis of 2010 to 2015 reporting has any information on results even if only in the form of outputs.

Stats Canada makes odd choices – to cite only one example, we know on a weekly basis the weight of all eggs laid and processed in Canada, but have no data on Fall 2013 college and university enrollment rates!

It will be worth watching if and how the budget refers to open data, transparency and evidence-based policy. Achievements in open data have been much celebrated rightly or wrongly, but we are a long way from what is really needed and can be achieved with relatively modest investment.[/vc_column_text][/vc_column][vc_column width=”3/12″][vc_widget_sidebar sidebar_id=”rightsidebar”][/vc_column][/vc_row][vc_row][vc_column width=”1/1″][themeone_spacer height=”20px”][/vc_column][/vc_row]

Budget 2016: High level areas

[vc_row][vc_column width=”9/12″][vc_column_text]by Aniket Bhushan

Published: March 21, 2016

The upcoming federal budget has generated a great deal of debate and expectation.

Much of the debate and indeed what people are most likely to look for (and probably stop there) is the size of the deficit and stimulative fiscal spending. The lead-up discussion and the budget itself, understandably, focuses on domestic tax and spend issues. Global aspects have received less attention.

In two posts we look at: high level areas that should be kept in view to interpret the budget (here below); and specifics on global affairs, development and trade (here).

Public opinion is conditioned and expectations have been raised high

As would be expected, the government has been playing the expectations management game for some time now. The last fiscal update (Feb 2016) set expectations to the upside with the 2016-17 deficit projection placed at over -$18 billion, before adding in stimulus measures, higher than what most observers were expecting.

Public opinion is conditioned – we are a long way from the Liberal platform commitment of deficits of no more than $10 billion – adding in what the Minister of Finance has repeatedly called “transformative investments” in infrastructure (not just hard infrastructure like transit etc. but also social), it is now unremarkable to expect deficits in the range of around -$30 billion.

Ratios and anchors

Any ‘anchors’ – be it in the form of maintaining the low net debt to GDP ratio or deficit to GDP ratio – are also held in abeyance (even double that $30 billion level would be only around 3% of GDP which is no longer unthinkable). Never mind that the oft repeated federal ratios would look quite different if provincial levels – where debt and deficit pictures are not nearly as rosy – were included (net debt at the federal level may only be around $615 billion, roughly 30% of GDP, but the provinces have accumulated nearly $600 billion additional; Ontario and Quebec together around $480 billion).

It is not a stretch to call the budget lead-up a sea change for Canada, and a fundamental turn from years of austerity and (at least the veneer of) fiscal discipline under the previous Conservative government.

Fiscal experiment

It also makes Canada a great experiment for whether deficit spending will work, not only in the sense of the needed short term stimulus but also in engendering the longer term transformation the new government has promised. Initial conditions – a confluence of low borrowing rates with the 10 yr around 1.3%, strong majority government with a clear mandate, internationally popular Prime Minister – are as auspicious as they are not generalize-able, at least among G7 peers.

There seems to be emerging consensus that the burden of stimulus needs to shift to fiscal policy. Monetary policy is pushing on a string with negative rate experiments in the EU, Japan and Nordic countries. More importantly, Canadian monetary policy can only drift so far from the US trend. Coming years in Canada could be a natural experiment in testing this argument. Can governments that really do have some fiscal space use the same to set their economies on a path different than the rest of the world through deficit spending?

Perhaps in a bid to lower expectations, the closer we got to the budget date the more there was a sense that no major surprises should be expected – the PM in New York has been upfront that the first few years of multi billion dollar infrastructure spending will be in ‘unsexy’ areas (maintenance, upgrades), and the government is quick to remind that key platform pieces like the middle class tax cuts are already in motion.

High level areas 

Whether implicitly or explicitly the budget should provide insight into the government’s take on simple but quite fundamental questions – just how weak is the Canadian economy, and what form of weakness is it?

Looking only at the headlines one may think this is pretty obvious. Consider the following:

  • WTI crude fell from around $107/barrel in June 2014 to $27/barrel in January 2016 – a drop of -75%
  • Today (late March 2016) it is around $40 – an increase of over 50% in less than 3 months
  • Over 3 short months since the Oct 19, 2015 election to Jan 19, 2016 the CAD/USD exchange rate, already down substantially from parity to around 0.77 cents, fell further dramatically, about 12% in 3 months – a whopping move for any currency
  • Since Jan 20, 2016 it is up 12%
  • The TSX, a reasonable measure of wealth effect, fell over 20% from mid April 2015 to mid Jan 2016
  • Since mid Jan it is up around 15%
  • Initially the expected positive effect of a low CAD on net exports was weak, but exports in the last few months have started to pick up
  • Employment has been hit hard in oil and natural resources segments of the economy – indicating just how much these matter which is often underplayed given their relatively small share of the labour market
  • But employment trends at the aggregate level have been surprisingly resilient – indicating that there is more to the Canadian labour market than resource reliance

The above may be stating the obvious. But some points are worth restating: things can change very quickly. There is a difference between volatility, which generally overshoots both to the up and downside; and structural weakness.

Clearly all this matters as the Finance Ministry has found out in the short time between the November 2015 and February 2016 updates – as indicated by the substantial changes in projections and assumptions they were forced to make.

So, perhaps it is not inconceivable that oil recovers if not to prior levels then to the trend projected in the earlier Fall update? Or US economic recovery – on which Canada is pretty much reliant – begins to strengthen?

Balance

What is unclear, and worth reading between the lines in the budget, is which side the government comes out on. Economics suggests wait and watch but be ready to act quick. Politics the opposite – go big now while the leash lets you chase, if it doesn’t work you are spoiled for choice for things to blame.

One indication may be how infrastructure investment is positioned. Is it as shovel-ready? Is it decentralized for this purpose and handled by lower levels of government more directly? Or is it longer-term? Beyond things like transit, does it expand to pipelines? Or is it distinctly aimed at greening the economy (or at least green-washing the brown, quite literally if oil sands clean up and clean tech are part of infrastructure)?

Clearly there is an East West and cross sector balancing act – transfers to Alberta have already been determined but Bombardier’s bail-out yet needs to be finalized (what with the Liberals returning to power thanks in part to a return from the cold in Quebec).

Another ‘tell’ could be the path back to balance. A budget aimed at preparing the groundwork for medium-term large negative numbers (which it could easily come back to beat if things change externally) so much so that deficit levels become a non-issue, would be consistent with the type of fundamental transformation the new government has targeted. On the other hand smaller deficits over a shorter time-frame may neither be enough to move the needle on stimulating the economy or bringing about any fundamental reorientation.

Who favors who opposes?

It is much easier to find supporters of large deficit spending, than detractors.

When you have Bay Street economists on the same side as Leftist think-tanks (who among other things advocate for financial transaction taxes), in supporting large deficit spending, you know that the debate has fundamentally changed in Canada.

On the left, CCPA in its alternative budget calls for the government to ‘not fear big deficits‘ and let it rise to -$38 billion. On Bay street, the chief economist of one of Canada’s largest banks, CIBC, goes even further and makes a persuasive case for why -$40 billion deficit would be ‘most appropriate‘.

Internationally Canada has a great deal of support – the IMF for instance has vocally supported using fiscal policy aggressively.

The other side of the argument is extremely wonky and means you have to buy into the ‘end of growth‘ idea (that we more or less have to accept low growth as the new normal). Or at least accept that things are really not that bad, or put another way, the economy is doing as well as it could. And accept that Canada is and will remain a resource reliant economy, at least for incremental growth.

At least as persuasive a case against the need for deficits can be made as for, if one gets wonkier (here is a great summary): economic multipliers are smaller for a small open economy like Canada’s and any stimulus will be prone to leakage across borders; fiscal policy may have limited efficacy under flexible exchange rates; it is unclear that demand is deficient if you look at quantity (as opposed to price level) indicators.

The detractor’s reactions are pretty well telegraphed. The thing to watch will be whether the unlikely consort of supporters are surprised, impressed or disappointed.

Bottom-line

With the two ends of the spectrum stretched as they are the middle ground could not be wider. Even if weakness is imported from external factors beyond control that could reverse just as quickly as they emerged, the government has bought itself near unprecedented license in investing to reorient the economy.

This budget should tell us whether the opportunity makes them nervous or bold.[/vc_column_text][/vc_column][vc_column width=”3/12″][vc_widget_sidebar sidebar_id=”rightsidebar”][/vc_column][/vc_row][vc_row][vc_column width=”1/1″][themeone_spacer height=”20px”][/vc_column][/vc_row]

Muskoka MNCH and Fragile States

[vc_row][vc_column width=”9/12″][vc_column_text]by Aniket Bhushan and Rachael Calleja

Published: February 29, 2016

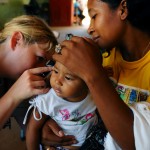
As a group, fragile states have lagged behind other developing countries in the achievement of many MDG targets, including those pertaining to maternal and newborn child health (MNCH). For instance, the OECD reports that by 2015, only one-fifth of fragile countries are expected to have halved infant mortality, while only one fragile state is expected to reach the target of reducing under-five mortality by two-thirds. With predictions that absolute poverty will increasingly be concentrated in fragile contexts, there is a growing need to pay special attention to programming in these countries.

Understanding Fragility

For our purposes, ‘fragile states’ are identified using the OECD-DAC’s International Network for Conflict and Fragility (INCAF) list of fragile states and economies for 2015. The list combines countries listed as fragile by the World Bank-African Development Bank-Asian Development Bank’s Harmonized List of Fragile Situations and the Fragile State Index created by the Fund for Peace, using countries that are listed in the ‘alert’ or ‘warning’ categories.

Different definitions of “fragility” posited by non-governmental third parties (for e.g. Carleton University’s Country Indicators of Foreign Policy) conceptualize fragility slightly differently. As a result, it is important to acknowledge that the analysis is likely to change if a different list is applied. To give one example, Bangladesh is not classified as fragile by the World Bank, but has been by others.

Overall MNCH

In 2010, the Harper Government launched the Muskoka Initiative on Maternal, Newborn and Child Health, committing to spend at least (as opposed to at most) $2.85 billion over five years. With the recent close of Canada’s initial commitment, we can now examine the overall picture of the Muskoka Initiative.

The figure below provides an overview of three things:

  • Overall Muskoka MNCH spending per fiscal year for each year of the initiative (grey bar chart).
  • Breakdown of spending by ‘baseline’ (i.e. continuation of MNCH spending that precedes the 2010 announcement, but is part of the overall commitment), and new ‘Muskoka’ spending, per fiscal year (blue and yellow line graph).
  • Breakdown between multilateral (green) and non-multilateral (red) Muskoka MNCH spending, as per the G8 methodology, per fiscal year.

Over the course of the commitment period, total Muskoka MNCH spending was approx. $3.123 billion. The commitment was exceeded by approx. $273 million or 9%.

Most of the excess came in the form of higher baseline spending. Baseline spending was $240 million higher than expected while new Muskoka spending was $30 million higher than expected. The reasons for exceeding commitments include higher than anticipated replenishment of health sector multilateral funds, compared to what was expected in 2010.

Muskoka MNCH spending by region over the total commitment time frame (2010 to 2015):

  • Africa: $2.11 billion
  • Asia: $681 million
  • Americas: $251 million

[/vc_column_text][themeone_quote]In 2010, the Harper Government launched the Muskoka Initiative on Maternal, Newborn and Child Health, committing to spend at least $2.85 billion over five years.

[/themeone_quote][vc_column_text]

Muskoka MNCH spending overview

[/vc_column_text][vc_single_image image=”6258″ border_color=”grey” img_link_large=”yes” img_link_target=”_blank” img_size=”large”][themeone_spacer height=”20px”][vc_column_text]MNCH and Fragile States

Of total Muskoka MNCH spending, $1.36 billion went to fragile states (approximately 44%) using the INCAF criteria, with the remaining $1.76 billion spent in other non-fragile recipients.

This number changes significantly when a different list and definition of ‘fragility’ is employed. For instance, using the World Bank’s 2015Harmonized List of Fragile Situations the total amount of MNCH spending in fragile states is $740 million, approximately 23.7% of overall spending.

MNCH spending in fragile contexts – applying the OECD INCAF approach (2015)[/vc_column_text][vc_single_image image=”6259″ border_color=”grey” img_link_large=”yes” img_link_target=”_blank” img_size=”large”][themeone_spacer height=”20px”][vc_column_text]

MNCH spending in fragile contexts – applying the World Bank fragile situations approach (2015)

[/vc_column_text][vc_single_image image=”6260″ border_color=”grey” img_link_large=”yes” img_link_target=”_blank” img_size=”large”][vc_column_text]Multilateral Spending on MNCH

Approximately 29% of Canada’s MNCH aid to fragile states was allocated through multilaterals according to the G8 multilateral methodology. However, the aggregate data masks important variation.  The proportion of funding allocated through multilaterals would be (a lot) higher if we examine the same at the project level. (This is typically referred to as the ‘bi-multi’, or multi ‘to vs. through’, or ‘bilaterliazation of multilateral aid’ problem.). According to our analysis, about 86% of total MNCH spending in INCAF fragile states can be assessed at the project level. At this level approx. 74% of Canadian MNCH spending is through multilateral channels. Among the multilateral agencies the largest are UNICEF, World Bank, WHO, WFP, UNFPA and GAVI. It is also worth pointing out that the majority of funding is “responsive” (‘used when Global Affairs Canada agrees to support development initiatives conceived by an external proponent that are consistent with the goals and objectives of Global Affairs Canada’s programs’). Core funding or long term institutional support is only significant as a percentage share in the case of the World Bank and GAVI.

Reverting back to the G8 methodology, as applied by GAC, within the fragile states grouping, there are stark differences between the proportions of aid through multilaterals for individual recipients. For instance, in several small fragile states, such as Micronesia, Kiribati, and Kosovo, upwards of 90% of MNCH spending is channeled through multilateral institutions. Similarly, more than 95% of MNCH aid to countries with active or recent conflicts (Libya, Iraq and Somalia) is channeled through multilaterals.[/vc_column_text][themeone_quote]Approximately 29% of Canada’s MNCH aid to fragile states was allocated through multilaterals according to the G8 multilateral methodology.

[/themeone_quote][vc_column_text]Conversely, non-multilateral spending is higher in countries that receive the largest amount of Canadian MNCH funding at the country level, including Afghanistan, Haiti, Nigeria, South Sudan and Mali, many of which have been Canadian priority or partner countries throughout the duration of the Muskoka Initiative.

The ratio of spending through multilateral and non-multilateral channels is similar for fragile and non-fragile states.

MNCH spending in INCAF fragile states that is classified as ‘multilateral’ (G8 method)

Green = multilateral, first line is non-fragile average[/vc_column_text][vc_single_image image=”6261″ border_color=”grey” img_link_large=”yes” img_link_target=”_blank” img_size=”large”][vc_column_text]Short vs. Long Term

A question we often get is whether development spending in fragile states, and Canadian MNCH spending more specifically, is short or long term. While it may seem straightforward, there are several challenges in addressing this question, largely down to data availability and interoperability between data sources.

Of the 793 projects (or lines of spending) that encompass Canada’s MNCH investment, we were able to analyze 662 in sufficient detail (by running database joins across sources). 384 of these were in INCAF fragile states. 192 or half were 3 years or less in duration, i.e. can be considered short term. The average duration MNCH projects in fragile states is around 3.8 years.[/vc_column_text][vc_column_text]Fragile States and GAC

In the 2014-15 financial year, Global Affairs Canada (GAC) spent approx. $3.43 billion on development programming (own calculations using data taken from the 2015 Public Accounts of Canada). Of this spending, $929 million, or 27% of spending, was allocated to GAC’s program on ‘fragile countries and crises-affected communities’, which includes spending on humanitarian assistance and programmatic spending for Afghanistan, Haiti, South Sudan, and West Bank and Gaza.

While in previous years, former DFATD allocated a proportion of funding to fragile states via a sub-program for ‘fragile states and affected communities’, recent changes to programming (or at least the reporting framework breakdown) reflected in the 2015-16 Report on Planning and Priorities shows that a separate sub-program for ‘fragile states’ no longer exists. The breakdown has gone from 5 (Canadian engagement for development; Fragile states and crisis-affected communities; Global engagement and strategic policy; Low-income countries; Middle-income countries) to 3 broader categories (International Security and Democratic Development; International Development; and International Humanitarian Assistance).

This makes it challenging to conduct forward looking analysis of expected spending specifically in the fragile states component of Canadian spending – or analysis of forward guidance on a more granular level more generally as the level of detail regarding development spending in the new framework is lower. A somewhat odd development given the recent mandate letter to the Minister of International Development explicitly calls for refocusing Canadian development spending “in support of fragile states”.


This analysis draws on a report prepared for World Vision (Canada), for more information please contact the corresponding author at: aniket.bhusan@carleton.ca[/vc_column_text][/vc_column][vc_column width=”3/12″][vc_widget_sidebar sidebar_id=”rightsidebar”][/vc_column][/vc_row][vc_row][vc_column width=”1/1″][themeone_spacer height=”20px”][/vc_column][/vc_row]

Is it time to change how we measure development effort?

[vc_row][vc_column width=”9/12″][vc_column_text]by Aniket Bhushan, with Rachael Calleja

Published: February 23, 2016

This post is part of a series that will summarize our analysis of commonly used measures of development effort. The objectives below are twofold:

  1. To describe (and challenge) the most widely used measure of donor development effort – the ODA/GNI ratio.
  2. To compare this measure with an alternative approach which focuses on ODA as a share of the budget or overall budgetary expenditure.

ODA/GNI or foreign aid as a share of donor gross national income 

The ODA/GNI ratio is the most commonly referred to measure of development effort. It has a long history going back to the 1960s and 70s (if not earlier) when the concept of foreign aid first took root. The key turning points in codifying the measure, arguably, were, the 1968 UNCTAD conference (N. Delhi) where consensus was reached on the 1%  overall flow target between richer and poorer countries (more on this below), and the 1970 UN declaration which made explicit reference to rich countries ‘exerting efforts’ to spend 0.7% of GNI as aid in poorer countries (for more, see references and discussion on aid targets here).

The figure below shows the long-term trend – since 1960, which is the start of the data series – for this ratio for major donors, as well as the DAC country average. Anytime a donor is at or above the target, the line is blue, when below, it is orange.

Figure 1. Major donors long-term ODA/GNI ratios

dac long term

As is obvious above, most donors have never met the target, and the DAC average (both weighted and unweighted) is consistently well below the target.

Nevertheless, for 5 decades, the ODA/GNI ratio and the 0.7 target have been the predominant way of framing and measuring development efforts.

This target and thinking was revived in the Millennium Development Goals (MDGs) and enshrined in the Monterrey Consensus on financing for development (2002) which accompanied the MDGs. More recently it is specifically mentioned in both the Addis  Ababa Action Agenda (July 2015) and the newly adopted Global Goals (September 2015).

The target and approach are made even more relevant by the fact that some donors such as the UK have enshrined it into law recently, and others (such as France and the EU) have laid out long term plans to reach the goal.[/vc_column_text][vc_column_text]Challenges and problems 

Given the above, what could possibly be wrong with the measure? Below are some of the more serious problems and challenges:

The model that forms the basis of this thinking is largely discredited: the “two-gap model”, which argued that the main constraint limiting developing countries from ‘take-off’ was the lack of savings (and hard currency), has been discredited. It assumptions – all aid would turn into productive investment, all investment would drive growth without frictions etc., and that the lack of hard currency savings is indeed the binding constraint – fail to hold in the real world.

Questionable orientation: it is worth remembering that the model, which forms the basis of measuring development efforts, takes as its starting point rich world income, rather than say poor country need.

Static share of rich countries income makes no sense: neither the two-gap model nor proponents since have ever really clarified why we should expect needs in developing countries to remain at a level that is an unchanging proportion of rich countries income? In other words 0.7 remains 0.7 in good times and bad, whether one part of the equation (rich) is doing as well, better or worse than the other (poor)?

Financial flow conditions are very different today (at least at the aggregate level): the two-gap model thinking goes back to the 1960s. Recall from above that the initial discussion, and consensus, that was reached among rich donors, was that at least 1% of their income (GNI) in total should go towards developing countries. This might have made sense in the 1960s when total flows were about 0.6 to 0.8% of rich world GNI, and two thirds of that was aid. Closer to the present (2010-14 average for instance) total flows are over 1% of rich world GNI. And this does not include the largest flow, remittances. Counting that in, total flows between rich and developing countries are well above the 1% level and hover around 1.5 to 1.6% of rich world GNI. More importantly, aid only makes up 15% of total flows. Private investment (FDI and portfolio) make up over 35%. This does not mean aid is not essential. In fact the contrary. This aggregate picture masks considerable variation. Countries that are not able to attract those other types of market based and other official flows face a dual problem. Competition for global investment is greater as many more developing countries have become ‘investable’. And competition for aid is greater because the demands on aid money are greater, aid allocation has become stricter and compared to the 1960s and 70s donors are proportionately less generous.

Not only have financial flow conditions changed but what counts in the numerator has changed and continues to change: the 0.7 thinking has remained constant but what counts as aid has changed and continues to change. For instance, in-donor refugee costs now make up nearly 5% of foreign aid. This spending takes place inside donor countries and yet is entirely within the definition of what counts as aid. This was not the case before the 1980s. The numerator has only changed in one direction – what can be counted as aid only expands. While it varies across donors, roughly only about half of bilateral foreign aid is ‘country programmable’ or the share that actually ends up in developing countries.

Lobbying tool that is turned into something more than a lobbying tool: 0.7 and the ODA/GNI ratio were originally merely lobbying tools to build support for international development and provide public opinion something simple to rally around. Lobbying is thought of as something that happens from the outside (civil society lobbies donors to commit to 0.7 for instance). What is rarely appreciated is the amount of lobbying that happens within government i.e. across competing bureaucracies, interests and priorities. Rediscovering 0.7, at least in some donor countries that recently committed to the target, is in part motivated by the goal of ring-fencing aid from internal lobbying. But it can have the opposite effect as other departments jostle for space especially when the aid agency (e.g. UK-DFID) is highly reputed (globally) and powerful. Advocates rarely appreciate that non-dynamic targets can work in both directions, i.e. not just increasing aid but reducing aid as was the case in Denmark recently.

The biggest challenge is that the type of thinking 0.7 connotes makes the development sector and development advocates look out of touch with reality and antiquated. At best they ossify existing support, at worst they hinder building new constituencies. It is damning after all for a sector that has evolved considerably in practice we have not managed to come up with anything better as a measure of development effort. (For more on the above, see the ghost of 0.7). New thinking in this area e.g. around the OECD’s modernizing ODA agenda and the total official support for sustainable development or TOSSD takes a similar approach, but adds in additional flows (‘catalytic effect of ODA’, ‘blended finance’, other ‘innovative instruments’).

What needs to change in how we approach measuring development effort? 

Of the many things that need to change we focus on two.

First, orientation: the starting point in measuring development effort must change to developing country need, and not donor income. One option which has been suggested (and needs more work) is to start by looking at the cost of provision of essential public services in the poorest countries, and place a floor under the real dollar value of per capita aid that donors commit to providing towards the same. Aid floors are motivated by the idea that “it is worse for a country to be deprived of resources on which it already depends than to not receive additional promised resources”. This would do two things. It would ground targets in a meaningful outcome that strips out the (huge) ‘transaction costs’ involved in aid delivery and focus on the end of the chain so to speak. It would also show that the current level of aid provided in the poorest countries, which by some measures may look praiseworthy, is actually far short of the amount needed to cover the cost of essential services. At a minimum it would help shift the focus away from donor income, to developing country need as the starting point.

The donor side of the equation, especially at a time when support for development is low and fiscal pressures are high, cannot be completely ignored. But even on the donor side we need a better measure of development effort than ODA/GNI and one that is more directly tied to fiscal effort.[/vc_column_text][vc_column_text]ODA as a share of budgets, or budgetary expenditure 

ODA as a share of a government’s forward looking budget or (retroactively) as a share of budgetary expenditure is a far better and easier to interpret measure of development effort. After all, arguably the budget is a policy variable in a way that national income is not. The budget is something a government has direct control over, whereas national income (GNI) is an outcome of a number of factors over which government policy has varying degrees of influence.

Measuring development effort in donor countries as a share of donor country budget is a more direct measure of fiscal effort and fiscal commitment to development. It is something people can more easily understand (at least compared to GNI, which is less used, compared to the more common GDP).

What does the picture look like, does it change anything?

First, it is worth pointing out that in our experience at least, this relatively simple change to the analysis proved more complicated than we expected. There are several reason but they boil down to lack of data consistency.

The OECD-DAC is the keeper of aid information and collects aid data from donor countries and publishes the same routinely, including the ODA/GNI ratio. But for whatever reason, it does not provide information on aid as a share of budgets in an equally accessible manner. To circumvent these issues and to conduct the analysis, where possible, along donor fiscal cycles and in donor currencies, we had to go country by country, compiling individual budgets and aid spending. This is the reason why our analysis is limited to the set of countries below. (See discussion of data below).

Figures 2 and 3 compare the standard ODA/GNI ratio with ODA as a share of the budget for the same set of countries – Norway, UK, Netherlands, Australia, Canada, US and Italy.

Figure 2. ODA GNI ratio for select countries 

oda gni

Figure 3. ODA as a share of budget, select countries 

oda budget

Findings

There are some notable changes in the picture if one moves to measure aid as a share of a donor’s budget as opposed to GNI.

  • Within this sample only two countries – Norway and the UK – meet the 0.7% GNI target.
  • Canada is among the lower performers with its ratio around 0.24% of GNI.
  • Norway is the most generous, by far, both as a share of its GNI and as a share of its budget.
  • For some countries the picture changes significantly when you look at the latter, i.e. share of the budget.
  • The UK has recently reached the 0.7% of GNI target. Canada by this measure provides about a third of what the UK does i.e. is far less generous.
  • However, Canada spends a larger share of its budget on foreign aid than the UK.
  • How can this be the case? The trends imply the UK’s budgets overall have been growing faster; certainly compared to Canada’s at least since 2009-10, and compared to the rate of change in UK national income (GNI). Its aid spending has been growing at an even faster rate.
  • Another factor that can make a significant difference, but is not straightforward to account for, is the difference in fiscal structures. While the UK is a ‘unitary’ state, Canada is highly federal. Which means UK spending is much more centralized (center accounting for 70 – 75% of total), compared to Canadian which is highly devolved (center only accounting for 25 to 27%). The starting point in other words from which the ODA/budget ratio draws, is inherently bigger in a unitary system like the UK compared to a federalized system like Canada.
  • Controlling for the above difference in fiscal structure, in a more apples to apples comparison or ODA as a share of only central government budgets, the UK’s ratio would increase to just around 2.1%, slightly higher than Canada (1.7%), in the latest year comparable data are available (2014). But the point holds – that the gap as a share of available fiscal space (budget or public expenditure) is narrower than the gaps as a share of national income.
  • Controlling for this however is made complicated by the fact that there are differences within federalized fiscal systems. For e.g. Australia is a federal system, but the center accounts for 60% of expenditure, much higher than Canada. Again, correcting for this, Australia’s ratio would also increase to around 1.8%, making it similar to Canada’s.
  • Canada’s ODA/budget ratio is higher even compared to the Netherlands, which fares better than Canada if instead the ODA/GNI ratio is used, and like Canada has been cutting aid spending.
  • The direction of travel for Canada’s trend however is downward while it is the opposite in the case of the UK.
  • Canada’s performance on these ratios is a byproduct of a set of factors – GNI has been growing slowly (flat, even declining in nominal terms in recent years), overall budgets are smaller and slower growing, recent declines in aid levels have been steep even when compared to others that have cut aid budgets (Netherlands, Australia).
  • Ultimately these ratios are a function of the overall level of government spending as a share of the economy. Here it is worth noting that overall government spending in Canada at around 40% of GDP tends to be lower than in countries like the Netherlands, Norway and UK which range around 45 to 50% of GDP. So the bigger pool, of which aid spending is a subset, is systematically smaller in the case of Canada, lower also compared to the OECD weighted and unweighted average.

[/vc_column_text][themeone_spacer height=”20px”][vc_column_text]Canada’s upcoming budget 

The ODA/GNI ratio and the logic of the 0.7% target have lost credence within official circles in Canada.

Canada’s federal budget will be tabled on March 22, 2016 (the government’s main estimates are released earlier). We have low expectations generally speaking when it comes to international development and aid spending.

That said, if any reference is made to development spending, for instance using the aid as a share of the budget measure, how should observers interpret this, what should they watch for?

  • Explicit quantitative targets: while we do not expect any explicit quantitative targets to be set, if this is not the case, it may be worth keeping in mind that historically Canada has provided about 2% of its budget to foreign aid (the US by comparison spends around 1%). In recent years with the budget cuts this ratio has fallen below 2% and is around 1.65%.
  • Reference to trends, averages: if an allusion is made to keeping aid at least at current budget levels, this could be interpreted as modest/low ambition – certainly compared to the rhetoric of Canada being back on the global stage. Remember, current levels are the product of years of cuts. A return to the average of recent years – at least 2% – would be more ambitious.
  • Watch the denominator: the more interesting indicator is the overall budget. According to our analysis Canada’s budget since 2009-10 has remained in a very tight range – between CAD$ 270 billion and CAD$ 280 billion (approx.). The substantial deficit projection already announced (CAD$ 18 billion) will have a material impact, but the size of the anticipated fiscal stimulus and if and by how much it increases the budget will be of keen interest. Only in this scenario would any allusion to keeping aid at current levels potentially yield an increase in aid, thanks to growth in the denominator.
  • Watch inflation and growth assumptions: at times references to future aid levels are framed in terms of increases in line with inflation or growth. It is worth keeping in view that inflation remains negligible and growth expectations have already been ratcheted down. Therefore to say aid flows will increase to keep pace with inflation may not mean much at all.


Description of data used to compile ODA/budget ratio (MS Word)

Budget_ODA Oct 25 (MS Excel)


This post was updated on March 10, 2016. For questions or comments contact the corresponding author at: aniket.bhusan@carleton.ca[/vc_column_text][/vc_column][vc_column width=”3/12″][vc_widget_sidebar sidebar_id=”rightsidebar”][/vc_column][/vc_row][vc_row][vc_column width=”1/1″][themeone_spacer height=”20px”][/vc_column][/vc_row]

Refugee costs in donor countries reported as ODA

[vc_row][vc_column width=”9/12″][vc_column_text]by Aniket Bhushan

Published: January 30, 2016

It may not be well-known beyond narrow foreign aid circles, but donors are allowed to count part of the cost of settling refugees in donor countries as ‘foreign’ aid.

In this post we look at the impact of the ongoing refugee and migration crisis on OECD-DAC (and select non-DAC) donor foreign aid budgets and reporting.

The analysis is based on recently updated (December 2015) OECD-DAC creditor reporting system data, and UNHCR data.

The analysis is timely given the DAC is discussing changes to the official definition of foreign aid, including potential new rules and criteria for what in-donor refugee costs can count (and how) as foreign aid.

Background 

The ongoing refugee crisis and its implications (including fiscal) for donor countries presents the latest challenge for donors as they think about the future of foreign aid.

Since 1988 the OECD-DAC has prescribed rules on what counts and how donors can report in-donor refugee costs as part of ODA. This is not uncontested however, even among donors. In 2001 the DAC working party on statistics debated removing in-donor refugee costs from ODA because, as some donors argued, inclusion of such costs (which do not entail a financial transfer to developing countries) undermines the credibility of the concept of ODA. But the proposition was rejected. Since that time this expenditure element has grown significantly and (as we see below) now makes up a significant share of ODA for several DAC donors.

This is particularly the case in recent years given the sharp increase in both the human and socioeconomic impacts of the refugee and migration crisis. Many donors (especially in Europe) have witnessed increases in refugee costs charged to their aid budgets and reported as ODA that represent a decisive break from long-term trends. This includes donors that are hailed as leaders in the aid community (for instance for meeting the 0.7% of GNI aid generosity target). By most accounts this crisis is neither close to ending nor a short-term blip. So this is merely the start of the potential impact from the perspective of aid budgets and reporting (especially as DAC reporting systems are so slow and dated. For e.g. the Dec 2015 update only brings the data up to final comparable figures for 2014. Whereas the impact in 2015 for many donors is likely even greater).

4 simple graphs below sketch key background information to help understand the issue.

Global refugee population growth rate 

Given the situation in Syria, the refugee crisis is growing at an almost unprecedented rate. Not since the late 1980s and early 1990s has the number of refugees in the world grown at rates witnessed over the last couple of years.

The total global refugee population now stands at around 15 million (14.3 million by 2014). Between 2012 and 2014 the refugee population grew at an astounding 36% (or approx. 22% in just one year from 2013 to 2014). Most of these refugees remain in countries in and around the region, and not in donor countries. That said the rate at which refugees are entering donor countries, especially in Europe, is unprecedented.

refugee pop

Donors and aid generosity 

The refugee crisis has been impacting donor aid flows for a few years now (at least since 2012 reporting). Three graphs below show the top 20 largest donors in the world, change in aid levels (2014 compared to 2013), and donor ODA/GNI ratios – the latter a benchmark of donor generosity that compares aid levels to size of donor economies (in this case gross national income).

The US remains the largest aid donor (by far) providing about $33 billion, out of the total $137 billion reported as OECD-DAC foreign aid. It is followed by the UK, Germany and the EU, among DAC donors. The surprise large increases in 2014 are from non-DAC donors. Chief among them Saudi Arabia which now ranks the fifth largest aid provider, ahead of France, Japan, and all the Nordic countries. As can be seen below, by far the largest increase in aid in 2014 compared to 2013 was from Saudi Arabia. Similarly, aid from Turkey and the UAE has also been rising in recent years. In each of these cases increases in aid flows relate to the ongoing crises across the region. Aid to and from these countries has been rising since the Arab spring.

Viewed from the perspective of the ODA/GNI ratio however, the most generous countries remain the Nordics – Sweden, Norway Denmark, and slightly behind is Finland; the UK (which recently achieved the 0.7 target); and the Netherlands. In 2014 (and 2013) however the UAE was the most generous with a ratio of 1.3% of GNI. Only 4 major DAC donors – Sweden, Norway, Denmark and the UK – now meet the 0.7% target; given the Dutch, whose aid flows have been largely declining since 2008, now fail to meet the 0.7 target.

As we show below, the ongoing refugee crisis has a lot to do with targets like 0.7 – and whether or not they remain relevant – given the link between aid flows and in-donor spending on refugee settlement.

overall ODA top donors

overall ODA top donors change 2013 14

ODA GNI ratio

Refugee costs in donor countries reported as ODA

The growing impact of the refugee/migration crisis, especially in European countries, is starting to have an effect on aid figures. Three graphs below illustrate this point.

First, as can be seen below, the amount of in-donor refugee costs reported as ODA has grown steadily. For all donors (DAC and non-DAC) this totals about $7.4 billion in 2014, the majority of which is reported by DAC donors. $6.6 billion or 4.8% of total aid from DAC donors is actually spent in donor countries, in the form of costs related to the settlement of refugees.

Since 2005 the share of in-donor refugee settlement costs as a percentage of total foreign aid has ranged between 2% and 3%. However in 2014 this ratio broke out of levels that would be predicted by near term trends, to nearly 5%. This is in keeping with the unprecedented jump in the number of refugees globally, and the growing number seeking refuge in European and other donor countries. (Note: these numbers do not include humanitarian spending by donors in the region, and are only the cost of settling refugees in donor countries that is reported as ODA).

In-donor refugee costs reported as ODA have also increased in non-DAC countries (in fact nearly 10-fold from 2013 to 2014), but from a low base.

However, as we see below, the ratio and the rate of growth varies greatly across countries and is much higher than the DAC average for a number of important donors.

in donor refugee costs agg

The graph below provides trend data for the donors that report the largest absolute levels of in-donor refugee costs as ODA. It also shows how much these costs have grown from 2013 to 2014.

The US, Sweden, Netherlands, Italy, France and Switzerland report the largest amounts in in-donor refugee settlement costs as ODA among DAC donors (Turkey reports a large amount among non-DAC donors).

Many donors have reported a sharp increase in these costs in 2014 compared to 2013. Key among these are Sweden (55% increase), Netherlands (151%), Italy (108%), Turkey (816%), and the UK (339%).

Herein lies an important issue when we use these figures in benchmarks of aid spending (like in the ODA/GNI ratio).

Expenditure elements such as in-donor refugee settlement costs, which have been added to the definition of foreign aid over the years, leave a lot up to donor accounting and reporting discretion.

Some donors who take in a lot of refugees typically have not reported a large amount in settlement costs as ODA at least in the past (e.g. UK and Germany). Others, that arguably take fewer refugees, have consistently reported a large amount of these costs as ODA (e.g. Switzerland). Whether and how this relates to actual refugee settlement – the subject of a forthcoming analysis – remains under analyzed. But we know there are discontinuities in the data that relate to donor discretion (e.g. likely linked to its own regional refugee/migration crises, refugee settlement costs accounted for around 5% of Australian aid in 2005 and 7% in 2013, with little or nothing in between or in 2014). So this expenditure element can be interpreted as an add-on, which donors add to the sum of traditional projects and other aid programming.

But it can change how we look at targets like 0.7.

For example, if we exclude in-donor refugee costs, Denmark which reports an ODA/GNI ration of 0.86 (well above the 0.7 target) and indicates a 58% increase in in-donor refugee costs in 2014 compared to 2013, would fall to 0.78 – still above the target but not by much (especially given Danish aid is expected to decline). The ratio would also fall for other stalwart aid donors like Sweden – still well above the 0.7 target, but nevertheless a big swing given in-donor costs now amount to approx. 18% of total aid, and are expected to increase substantially. The Netherlands, which no longer meets the 0.7 target would see its ratio go from 0.64 to 0.52 – also a big swing given the sharp increase in refugee costs in 2014 which now account for 17% of Dutch aid.

Perhaps the standout impact of removing in-donor refugee costs from ODA would be in the case of the UK which has been much celebrated as the latest major donor to meet the 0.7 target (in turn bolstering the target’s relevance). Even though the UK reports a relatively small amount in in-donor refugee spending as foreign aid, because this jumped substantially in 2014, if we remove this element, the UK no longer meets the 0.7 target in 2014 (albeit by a fraction).

in donor refugee costs per donor and percent change

As the figure below shows in-donor refugee costs now make up a large and growing share of a number of donor’s aid spending. Small donors like Malta are obvious outliers, but in-donor refugee costs now make up more than 5% of total ODA, i.e. are higher than the DAC average, in at least 9 major DAC donors.

in donor refugee costs per donor share of ODA

There is a great deal of talk about policy coherence and whole-of-government approaches in the aid community. Nowhere is the need for action more apparent or urgent than in the case of refugee settlement. Aid agencies may have a greater role to play at home in the future than is currently envisaged. And success at home may have a greater impact on the efficacy of traditional aid programming overseas.

Looking ahead, longer-term perspectives that aim to secure greater and more predictable financial resources, which will invariably be needed to counter even more costly crises and their potential refugee/migration impacts (e.g. as a result of climate change), should guide how we update our thinking on aid and donor agencies today.[/vc_column_text][/vc_column][vc_column width=”3/12″][vc_widget_sidebar sidebar_id=”rightsidebar”][/vc_column][/vc_row][vc_row][vc_column width=”1/1″][themeone_spacer height=”20px”][/vc_column][/vc_row]

Climate Change

[vc_row][vc_column width=”1/1″][themeone_header type=”h2″ txtalign=”txt-left” decor=”” decorheight=”2px”]

The COP 21 climate change conference in Paris, including Canadian perspectives and approaches.

[/themeone_header][/vc_column][/vc_row][vc_row el_class=”primary_viz_container” to_equal_column=”” to_para_bg=”no_bg” to_parallax=”” to_side_img_position=”left” to_para_img_repeat=”no-repeat” to_para_blur=”” to_para_over_set=”” to_para_over_opacity=”0.8″][vc_column width=”1/1″][vc_column_text]

[/vc_column_text][/vc_column][/vc_row][vc_row][vc_column width=”1/1″][themeone_spacer height=”20px”][/vc_column][/vc_row][vc_row][vc_column width=”9/12″][vc_row_inner][vc_column_inner width=”1/2″][themeone_header type=”h3″ txtalign=”txt-left” decor=”” decorheight=”2px”]

Emissions proposals from the top 10 emitters: A look behind the numbers

[/themeone_header][vc_column_text]Summary and analysis of nationally determined commitments from the top 10 emitters in the world, including Canada.

Emissions proposals from the Top 10 emitters[/vc_column_text][themeone_header type=”h3″ txtalign=”txt-left” decor=”” decorheight=”2px”]

COP21: A beginner’s guide

[/themeone_header][vc_column_text]What are the main climate finance mechanisms? What are Canada’s contributions to global climate finance? What was agreed to at previous COPs? What are the issues at play in COP21 and what success may look like for the Paris Climate Alliance?

Guide to COP[/vc_column_text][/vc_column_inner][vc_column_inner width=”1/2″][themeone_header type=”h3″ txtalign=”txt-left” decor=”” decorheight=”2px”]

About the data above

[/themeone_header][vc_column_text]CAIT Climate Data Explorer. 2015. Washington, DC: World Resources Institute. Available online at: http://cait.wri.org .  Please Note: CAIT data are derived from several sources. Any use of the Land-Use Change and Forestry or Agriculture indicator should be cited as FAO 2014, FAOSTAT Emissions Database. Any use of CO2 emissions from fuel combustion data should be cited as CO2 Emissions from Fuel Combustion, ©OECD/IEA, 2014.

CAIT Climate Data Explorer[/vc_column_text][themeone_header type=”h3″ txtalign=”txt-left” decor=”” decorheight=”2px”]

What to look for during the Paris climate change conference

[/themeone_header][vc_column_text]Analysis contributed by the International Institute on Sustainable Development. The six major issues that need to be resolved at COP21 in Paris.

6 major issues at COP[/vc_column_text][themeone_header type=”h3″ txtalign=”txt-left” decor=”” decorheight=”2px”]

The Canadian Approach to COP21

[/themeone_header][vc_column_text]Canada’s approach to COP21; a review and summary of provincial level plans.

Review and summary of provincial plans[/vc_column_text][/vc_column_inner][/vc_row_inner][/vc_column][vc_column width=”3/12″][vc_widget_sidebar sidebar_id=”rightsidebar”][/vc_column][/vc_row][vc_row][vc_column][vc_column_text]

[/vc_column_text][/vc_column][/vc_row]


Deprecated: Function get_magic_quotes_gpc() is deprecated in /var/www/cidpnsi/wp-includes/formatting.php on line 4342