
Use this dashboard to analyze Canadian portfolio investment assets overseas in developing and advanced economies.
About
The rapidly increasing value of foreign securities held by Canadian investors represents an important aspect of Canada’s engagement abroad.
In 2019 outward portfolio investment, comprised of equity and investment fund shares and debt securities, totaled $2.6 trillion, representing a 18.7% increase over the previous year. This dashboard can be used to analyze outward Canadian portfolio investment by recipient income group, region, and specific countries.
How to use the data
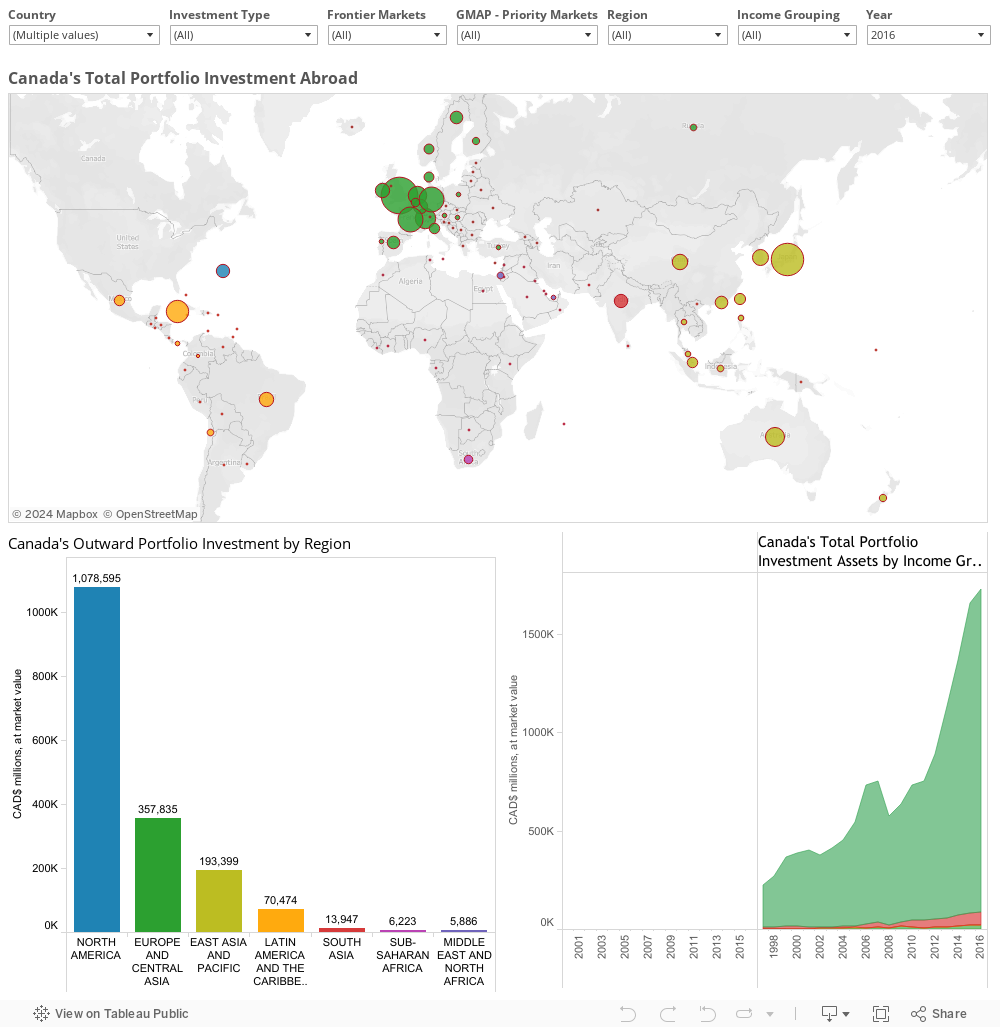
Hover over country circles on the map to see the value of foreign securities held by Canadian investors in that country. Circles are sized to reflect the value of foreign securities in the selected year (by default 2016).
The bottom left pane represents the distribution of Canada’s portfolio investment across regions and the bottom right pane represents the distribution by income group.
Clicking a country on the map will replace the bottom right pane with a country-specific time-series analysis of investment in the selected country. Multiple countries can be selected at one time for comparison (no more than two at a time are recommended). Hold down Control + right click. Click again to deselect.
The data can be filtered with the dropdowns at the top of the dashboard. Use drop-downs to limit the data by ‘Country’, ‘Investment Type,’ ‘Frontier Markets,’ ‘Global Market Action Plan (GMAP) – Priority Markets,’ ‘Region,’ ‘Income Grouping,’ and the ‘Year.’
What the data show
High income countries account for 94% of the total at $2.42 trillion Canadian portfolio assets (at market) overseas in 2019. The United States, at $1.66 trillion, alone accounts for 64% of all portfolio assets. The United Kingdom ($134 billion), Japan ($96 billion), and France ($63 billion) are the next three top destinations for Canadian foreign portfolio holding, both debt and equity.
$155 billion or 6% of Canada’s total foreign portfolio investment assets are among developing countries; primarily in China ($42 billion), Brazil ($25 billion), and India ($24 billion). Canadian owned portfolio assets in developing countries have been growing steadily at about 13.1% CAGR since 2001.
Geographically, 65% of foreign portfolio assets are within North America, 18% in Europe and Central Asia, 10% in East Asia and the Pacific, and 4% in Latin America and the Caribbean.
Among developing countries: Canada’ debt securities are largely geographically positioned in Latin America and the Caribbean, which accounts for 47% of debt securities in developing countries. Mexico and Brazil make up 33% of Canada’s holdings of debt securities holdings among developing countries.
By contrast, equity and investment fund shares are largely distributed in East Asia and the Pacific, representing 46% of the share among developing countries. China, Brazil, and India make up the majority of these investments in developing countries and have experienced a 32%, 16%, and 27% CAGR respectively since 2001.
About the data sources
Data up to and including reporting year 2016 is drawn from Statistics Canada, ‘CANSIM, Table 376-0064, International Investment Position, Canadian Portfolio Investment Abroad at Market Value, by Country.’ Data for reporting years after 2016 is from Q4 reporting of Statistics Canada, ‘CANSIM, Table 36-10-0368-01, International investment position, Canadian portfolio investment abroad at market value, by country.’ The World Bank’s geographical and income classification system is used. For comparison with aid flows countries were also classified using the OECD-DAC system.
Recent Comments