

Quick overview of recently released comparative aid statistics from the OECD-DAC for 2015. Click on images below to see full page view.
Comparative ODA and ODA/GNI levels
Key year-on-year changes
About
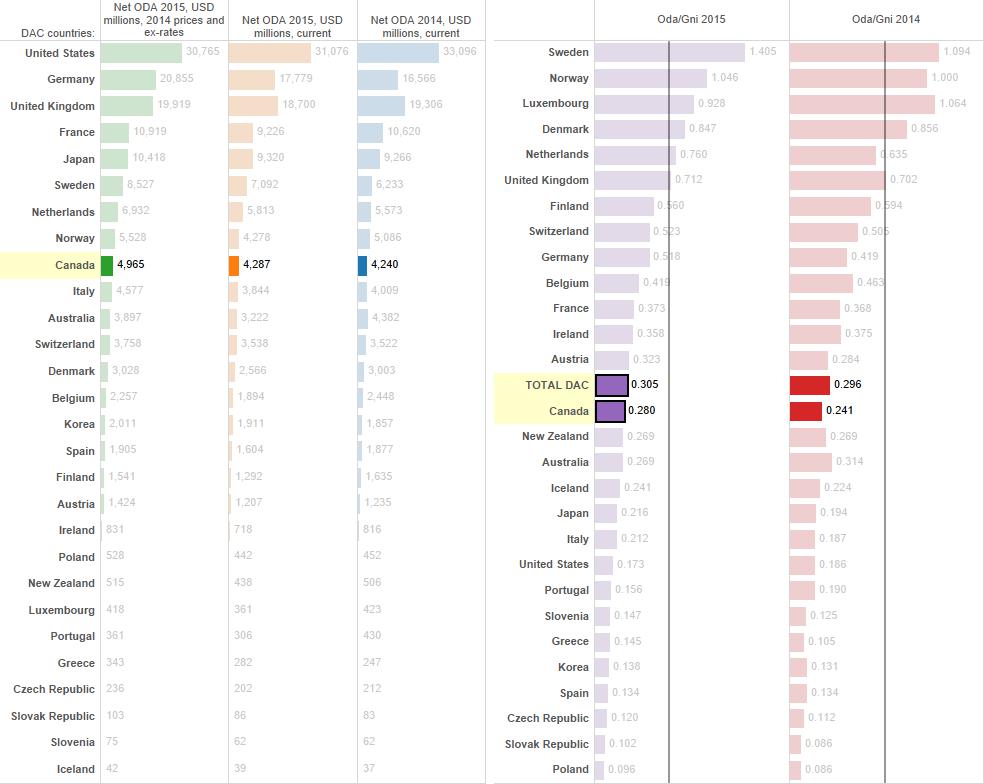
Total net ODA from OECD-DAC countries reached US$ 131.6 billion in 2015, in current US$ terms. However net ODA reached US$ 146.6 billion, at 2014 prices and exchange rates.
According to the OECD-DAC, “ODA is up 83% [in real terms] since 2000, when the Millennium Development Goals were agreed”.
Story behind the numbers
The OECD-DAC numbers, while official and high quality, can be challenging to interpret. Two pieces of the puzzle are critical to understand in order to interpret the most recent data i.e. for 2015, appropriately:
- Currencies: movements in exchange rates are a huge part of the story this time around. This is because most of the 28 OECD-DAC countries saw their exchange rates depreciate substantially against the US$. Adjusting for this effect (and inflation) as the DAC does in calculating ‘real change’ indicates net ODA increased by around $9.4 billion or around 7%. If we do not adjust for this and instead treat all DAC countries ODA in current US$ terms, net ODA actually fell by -$5.6 billion.
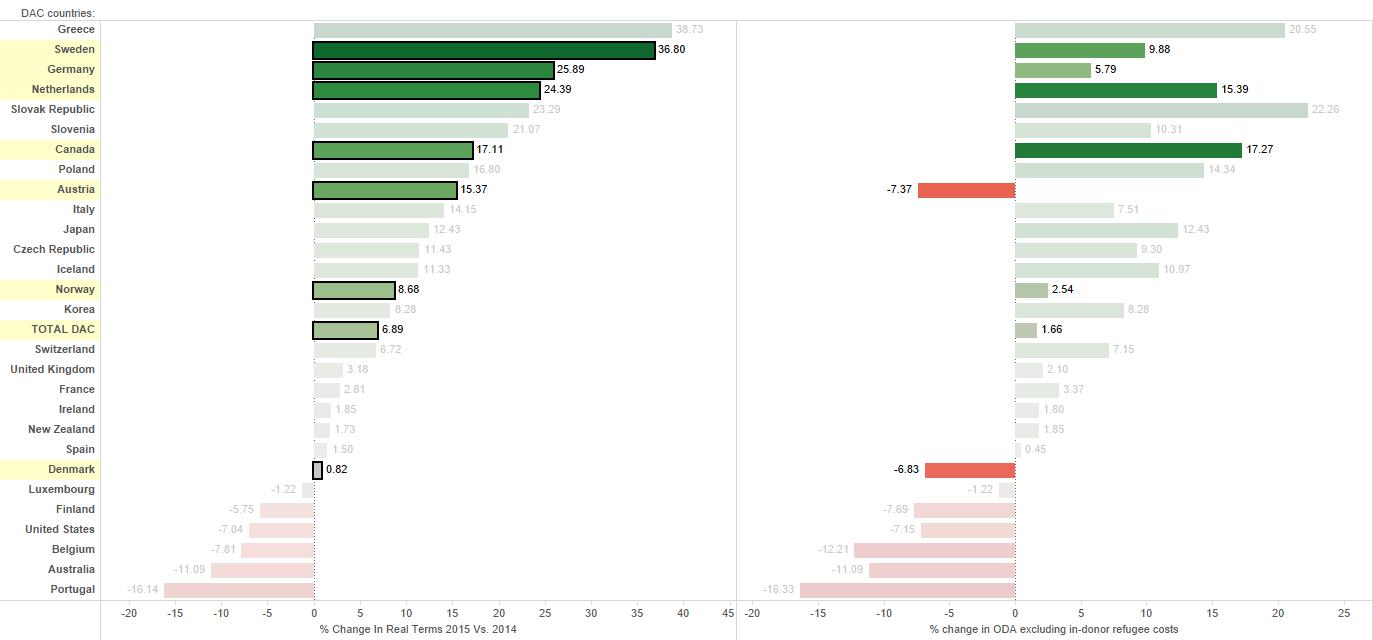
- Refugees: as mentioned above, the data indicate an increase in net ODA in real terms of approx. 7% 2015 compared to 2014. However, during this period in-donor refugee costs doubled. This is money spent inside donor countries on the costs of settling refugees, but according to DAC rules is allowed to be reported as ‘foreign aid’ (to a large extent the accounting is up to donor discretion). If we strip out in-donor refugee costs, net ODA only rose 1.66%, i.e. far lower than the reported 7% increase. This means a large share (approx. 70%) if the increase in net ODA is due to in-donor refugee costs which have spiked as more and more people seek refuge from conflicts like (but not limited to) Syria, especially in Europe.
Refugee costs and key European donors
It bears repeating just how much refugee costs are impacting ODA numbers.
Take for instance Sweden, Germany and Netherlands. The DAC reports increases in ODA for each respectively of 36.8%, 25.9% and 24.4%. If we strip out in-donor refugee costs however, these increases fall substantially – to 9.8%, 5.8% and 15.4% respectively. In other words the sharp increase in ODA is driven by the dramatic rise in refugee costs.
Even more extreme examples are Austria and Denmark – ODA has reported to have increased by approx. 15% and 1% respectively. Strip out refugee costs, ODA fell, substantially, approx. 7% in each case.
About the data and source
For more, please visit the OECD-DAC aid statistics page. See also, the DAC’s narrative summary. And detailed data (pdf).
Download our clean, summary version of the data used above. (MSExcel)
Canada in the OECD-DAC (preliminary)
The main objective of this quick preliminary analysis is to reflect on the data from the perspective of where Canada stands relative to OECD-DAC donors.
- Canada’s aid totaled approx. US$ 4.9 billion in 2015, if viewed in 2014 prices and exchange rates (again, as the DAC does to calculate real rates of change)
- This compares with approx. US$ 4.2 billion in 2014
- Canada’s ODA, in real terms, increased a whopping 17%, 2015 vs 2014 – making it one of the largest increases among larger DAC donors
- Canada’s ODA/gross national income (GNI) ratio now stands at 0.28% — a jump up from 0.24% in 2014 (which was a historical low on the backs of sharp cuts of approx. -11% in both 2014 and 2013)
- By comparison Canada’s aid in 2012 totaled US$ 5.6 billion
- In volume terms Canada now ranks the 9th largest OECD-DAC donor – Canada’s rank has moved up one place
- By comparison, in 2012 Canada ranked the 6th largest OECD-DAC donor, in 2013 Canada ranked 9th, in 2014 Canada’s rank fell to 10th
- In terms of the ODA/GNI (or generosity ratio) Canada’s ratio, at 0.28% is now very close to the OECD-DAC average of approx. 0.3% – and has moved up significantly from Canada’s 2014 level at 0.24% of GNI which was far below the total OECD-DAC level at 0.29%
- Based on the ODA/GNI ratio Canada now ranks 14th among the 28 DAC members, up from 16th in 2014; and back to the level it was in 2012 and 2013
This is a preliminary analysis of headline figures which provide only a partial sense of Canada’s wider contribution to international development.
The story – and CAD$800 million+ problem – behind Canada’s numbers
Headline figures taken at face value are highly misleading especially if viewed as a reversal of recent (downward) trends, at least in Canadian ODA. While refugee costs are a major explanatory factor especially for most large European donors. They are not a factor (at least not yet i.e. not in this reporting cycle) for Canada.
However there are two other important issues in this particular reporting cycle.
From Canadian data – released back in December 2015 and updated again in March 2016 – we know there are exceptional items in this particular year.
- The first is an exceptional double payment to the World Bank (International Development Association or IDA) which is essentially a one-time administrative issue. This however accounts for approx. CAD$441 million of reported ODA.
- The second – less clear from DAC data or analysis – comprises two loans made to Ukraine totaling CAD$400 million. This actually makes Ukraine, by far, Canada’s largest aid recipient, as the loans seem to have been booked entirely as ODA.
Together these account for a CAD$800 million+ one time anomaly in reported Canadian ODA.
While there is not a one to one relationship between Canadian and DAC data (due to currency and fiscal vs. calendar year normalization), one can safely conclude that if the impact of these one-time entries is stripped out or somehow smoothed, Canada’s ODA declined, not increased (as suggested by the DAC and discussed above). Indeed, stripping these payments out would show that Canada’s ODA/GNI ratio declined further.
These findings, while not without problems, nevertheless represent a serious challenge to the integrity of the DAC’s data.
Recent Comments