
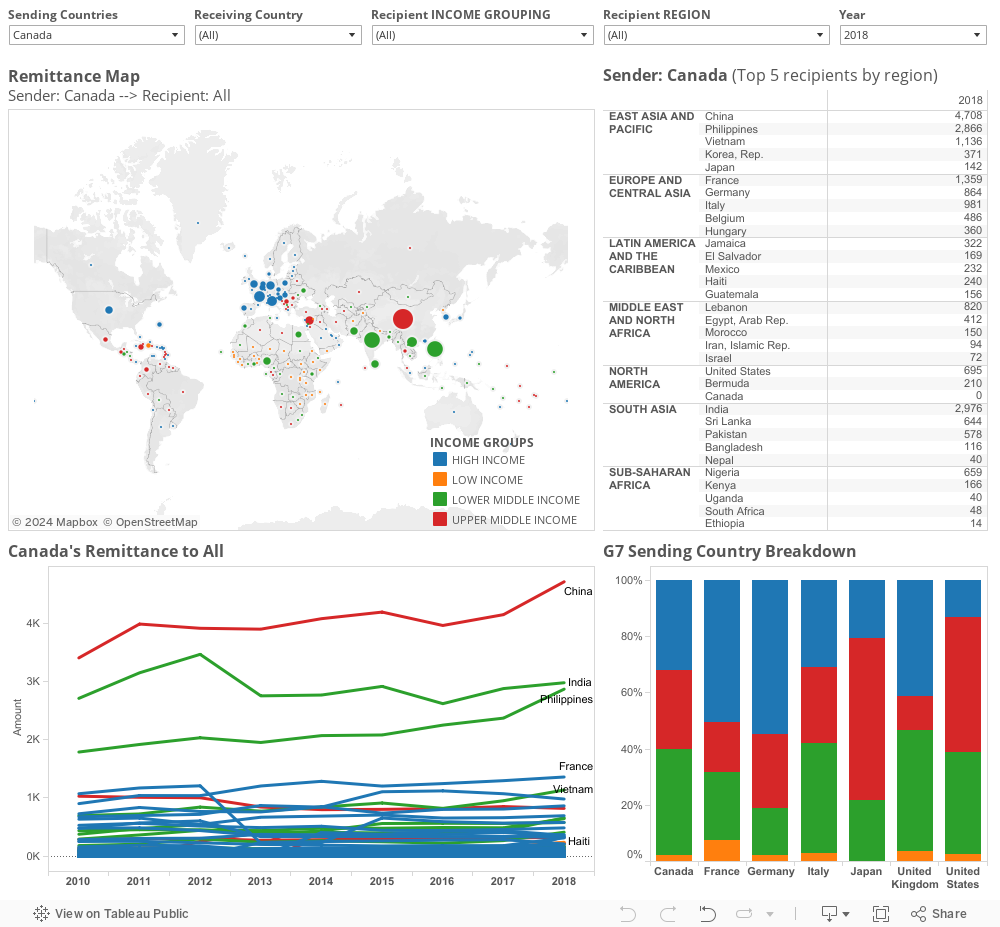
Use this dashboard to explore remittances outbound from Canada to developing and advanced economies.
About
Globally, remittances sent home by migrant workers are estimated to be anywhere from 3 to 4 times aid flows.
Our estimates for 173 countries for which comparable data was available shows that remittance outflows from Canada to these countries are about 4 times larger than aid flows. Remittance estimates are larger than aid even for some of Canada’s largest aid recipients including: Pakistan, Haiti, Lebanon, Vietnam, Nigeria, Kenya and others. The largest estimates of remittance outflows from Canada are to China ($4.7 billion) and India ($3.0 billion). The total remittance outflow from Canada (to all countries including developed) is estimated at $27.8 billion in 2018; up from $24.6 billion in 2017.
How to use this data
Hover over country circles on the map to see the amount of remittances sent from the sender country (Canada is the default sender country). Circles are sized to reflect the amount of remittances a country receives in the selected year (by default 2018).
To change the sender country, select a country from the ‘Sending Country’ dropdown. Additionally, use drop-downs to limit the data by ‘Receiving Country’, ‘Recipient Income Grouping,’ ‘Recipient Region,’ or change the ‘Year.’
Clicking a country on the map will highlight the country in the list pane, and will present the time series line graph for remittances to that country. Multiple countries can be selected at one time for comparison (no more than two at a time are recommended). Hold down Control + right click. Click again to deselect.
Lastly, the bottom right pane is a comparison of G7 countries’ outgoing remittances to income groups. Amounts are given as percentages of total outgoing remittances and absolute amounts can be found by hovering over the income group.
What the data show
In 2018, 66% or $18.3 billion went to upper and lower middle income countries; 32% or 8.9 billion went to high income countries; and about 2% or $552 million of outbound remittances from Canada went to low income countries. All figures are in US dollars.
Among developing regions, East Asia and Pacific received $9.2 billion, South Asia $4.4 billion, Middle East and North Africa received $1.5 billion, Latin America and Caribbean $1.1 billion, and Sub Saharan Africa received $927 million.
About the data sources
Data is drawn from CIDP migration analytics, the World Bank’s bilateral remittance matrix; and the World Bank’s remittance price corridor database. None of the underlying data has been altered in any way.
However, the country coding has been enhanced by adding World Bank income and regional country classifications to facilitate analysis.
The final dataset is available here: Remittances-2019-web.zip (1.6mb)
Data issues
Migration data (number of migrants, stock, entries per year) tends to be of a high quality. However remittance data is based on assumptions.
The World Bank’s remittance matrix data is based on assumptions using migrant stock, host country incomes and origin country incomes. We have found large discrepancies between this and other data from the same source. For instance while the bilateral matrix estimates global remittances at around $500 billion, the Bank’s own remittance outflow database (which relies on data from the IMF, national statistical agencies and Bank country offices) reports the figure at around $337 billion, for the same year (2011).
The discrepancy maybe explained by the fact that some countries included in the assumptions based database (bilateral matrix) are not covered in the outflow database (which relies on national and international sources). Therefore these figures should be interpreted with caution, but are useful in providing a sense of the scales involved.
[…] (For more data on Canadian remittance flows see here: http://cidpnsi.ca/remittances-explorer/) […]