
This tool can be used to analyze imports into Canada at the detailed product level (HS2 and HS4). How large is the Canadian import market for a given product? How has it evolved over time? Which countries account for how much of the import market share?
About
How large is the Canadian import market for a given product? How has it evolved over time? Which countries account for how much of the import market share? This tool can be used to analyze the Canadian import market at a detailed product level, using the Harmonized System (HS2 and HS4).
The visualization and analyses were developed as part of a wider project with a Canadian civil society organization dedicated to improving market access for developing country exports into Canada.
Extracting the data
Data can be freely extracted from the above dashboard by using the built in export options. Click on any graph panel, and select the export options (share or download) to export data as PDF, image file or directly to MS Excel cross tab.
Given the size of the data it is not possible to post the entire data base as a single flat file.
How to use this data
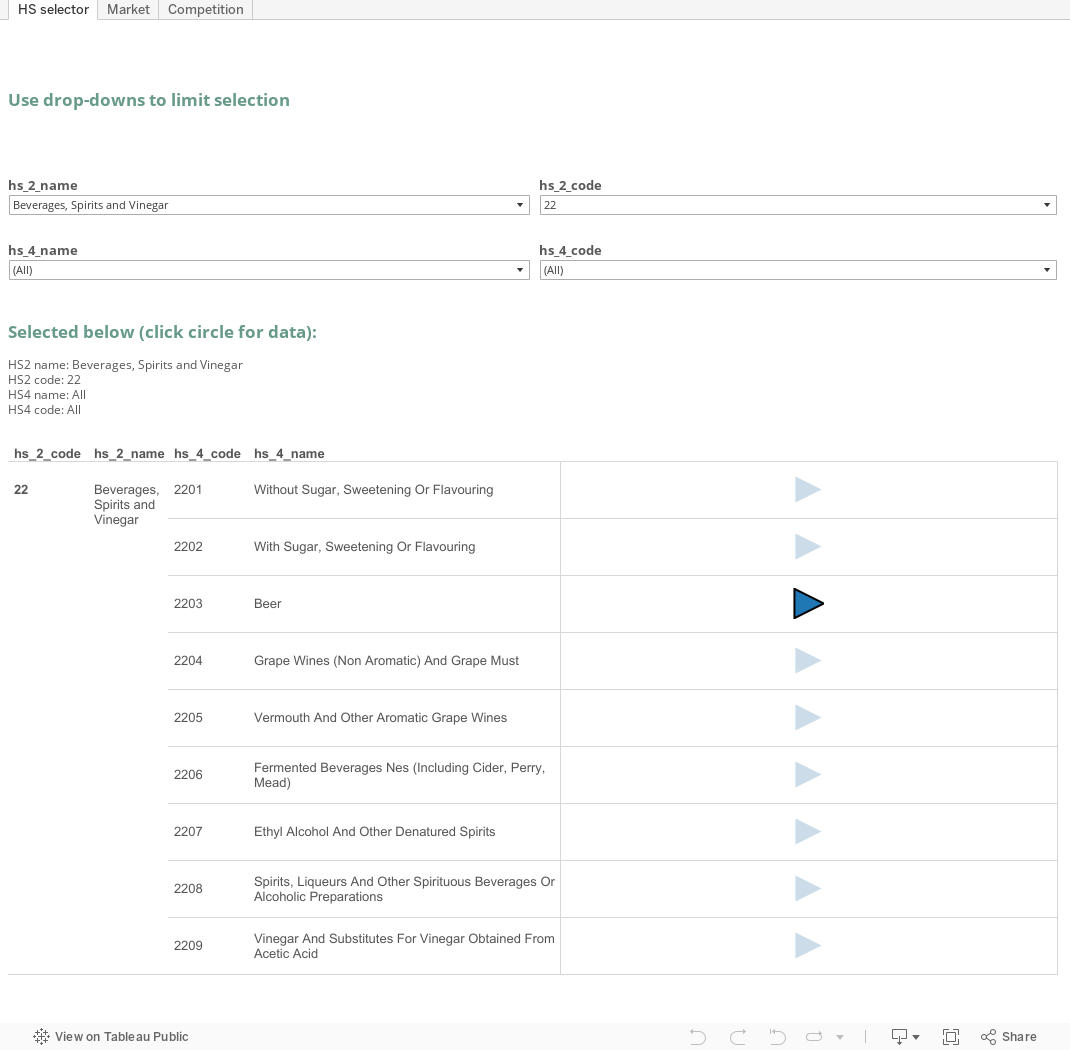
The visual analysis structured as a three step process. Using the first, default view, select the product of interest. All product types have been grouped hierarchically using the HS system, such that all HS4 categories that fall under parent HS2 groups can be navigated to by selecting the broad product type (e.g. Beverages) and going to the more specific product of interest (e.g. Beer).
Select the product of interest by clicking on the circle associated with the product.
This will switch the viewer to a trend graph of how the Canadian import market for the chosen product has evolved since 2000.
Click anywhere on this graph, and the view will switch again to a dis-aggregated picture of which countries account for what share of the given product’s import market, and how the market has evolved since 2000.
For more information
For more information on this or other tools and solutions related to ongoing work on trade, please contact us by commenting below or using the contact form
Recent Comments