
Quick overview of comparative aid statistics from the OECD-DAC for 2020. Click on images below to see full page view.
DAC Country
Comparisons
(Click Image to Enlarge)

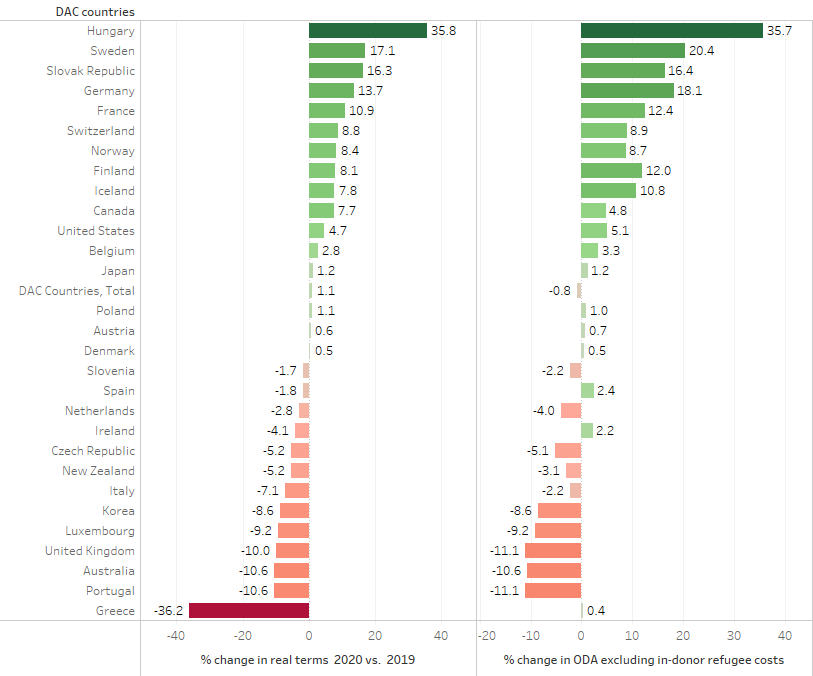
Key Year-on-Year
Changes
(Click Image to Enlarge)
Comparative ODA and
ODA/GNI levels
(Click Image to Enlarge)

OECD-DAC Donor Spending in 2020
Net ODA from OECD-DAC countries reached US$ 161.2 billion in 2020, in current US$ terms. This represents a 4.4% increase in real terms from the 2019 figures; a continued upward year-over-year trend from last year’s figures (a 1.7% increase).
Canada’s Performance in the OECD-DAC
The main objective of this analysis is to reflect on the data from the perspective of where Canada stands relative to OECD-DAC donors.
- Canada’s aid totaled approx. US$5.03 billion in 2020. This compares with approx. US$4.76 billion in 2019 (both in current prices).
- Canada’s total ODA increased substantially by 7.7% in 2020. Excluding in-donor refugee costs, Canada’s ODA increased by 4.8% in from 2019 to 2020 in real terms.
- Canada’s ODA/gross national income (GNI) ratio now stands at 0.31% — significantly higher than last year (0.27%). This ratio is below the OECD-DAC weighted average of 0.32% and the unweighted DAC average country effort of 0.41%.
- Canada is the 8th largest OECD-DAC donor in volume terms. Canada’s rank has been as high as 6th in 2012.
- Using the ODA/GNI ratio Canada now ranks 13th among the 29 DAC members, up from 16th in 2019.
- In 2020, in-donor refugee costs comprised 12.5% of Canadian ODA, the highest proportion for a donor in the DAC donor.
This is a preliminary analysis of headline figures, which provide only a partial sense of Canada’s wider contribution to international development.
The story behind Canada’s numbers
The increase of Canada’s net ODA (in real terms) can be attributed to the increase of in-donor refugee costs. These costs include money spent inside donor countries for settling refugees during their first year, which according to DAC reporting rules can be reported as ‘foreign aid’ (accounting and reporting as ODA is up to donor discretion).
In 2020, Canada’s in-donor refugee costs increased from US$631 million from US$476 million, a real increase of 4.8%.
While total in-donor refugee costs declined for DAC members by 9.5% to US$9.0 billion in 2020, costs for in-donor refugees represented more than 12.5% of Canada’s total ODA – the highest proportion among DAC members.
Story behind the DAC’s ODA numbers
Factor 1: additional COVID-19 funding
For many countries at the time the pandemic hit, their 2020 ODA budgets were already in place. While many donors planned to maintain their planned 2020 ODA commitments, some were able to mobilise additional funding to target the developing COVID-19 crisis in recipient countries.
Given the economic impacts of COVID-19 on donor countries it is currently uncertain how ODA budgets will be affected in the future, or if the current levels of donor funding is sustainable. While the DAC notes that members have mechanisms in place that smooth ODA volumes in the event of sudden changes to available resources, CIDP has previously described the risks of fragmentation in ODA programming due to COVID’s economic impacts.
Factor 2: increase in bilateral sovereign lending by some loan-giving members
In 2019, the DAC ODA reporting methodology was adapted to include the grant equivalent measure of other non-grant instruments, such as equities and private sector instruments (PSI), to better reflect the donor effort involved.
In 2020, bilateral sovereign loans by DAC members to ODA-eligible entities totaled US$13.0 billion, up from US$9.8 billion in 2019. In real terms this represents a 38.7% increase.
The countries that recorded the highest increases in real terms of sovereign loans on a grant equivalent basis were France (63%), Germany (69%), Italy (55%), Japan (11%), Portugal (143%).
The DAC and COVID-19 related ODA
DAC Members’ ODA to COVID-19 related activities
(Click image to enlarge)
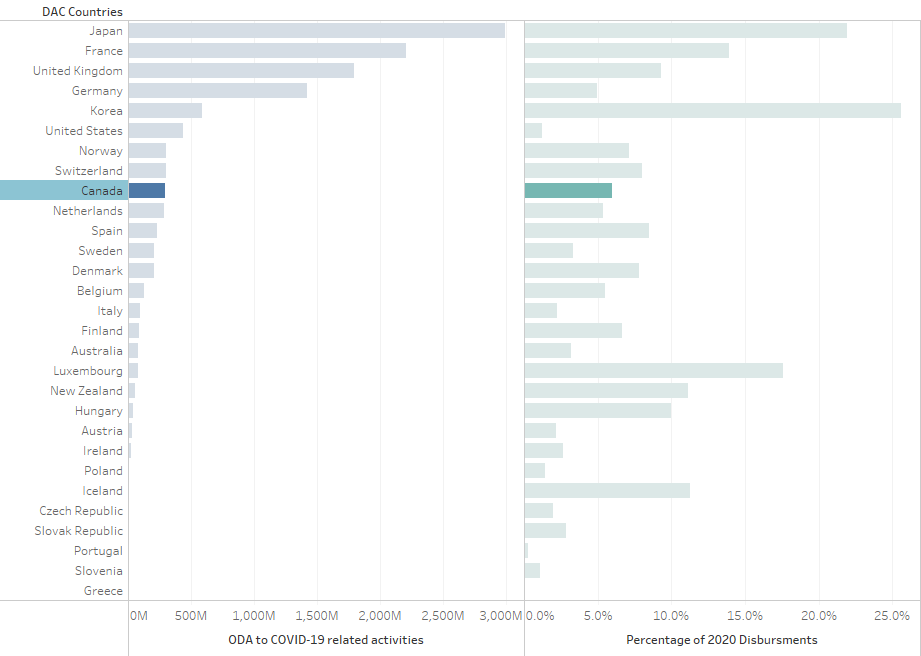
In addition to the typical annual ODA reporting, the OECD’s Development Co-operation Directorate conducted a special survey in April-May 2020.
- DAC countries spent USD 12 billion in 2020 on COVID-19 related activities.
- Canada spent US$293M on COVID-19 related activities and ranks 9th among DAC donors’ COVID-19 related ODA.
- Canada targeted approximately 6.0% of it’s ODA spending towards COVID-19 related activities, just below the weighted DAC average of 7.4% and the unweighted DAC average country effort of 7.4%
Note that these figures on COVID-19 related activities are preliminary and partial, as many donors are still in the process of collecting detailed information, especially sector-related data.
About the data and source
For more, please visit the OECD-DAC DAC’s narrative summary.
Download our clean, summary version of the data used above. (MSExcel)
Recent Comments