by Aniket Bhushan
Published: October 11, 2017
In July 2017, the OECD-DAC released its study on Amounts Mobilised from the Private Sector by Official Development Finance Interventions. Here we summarize key take-away(s) from our analysis of the report and associated data.
Better data on a woefully understudied, not well understood and yet increasingly important area of development finance should be welcomed—but there are significant blind-spots.
The OECD-DAC has been conducting ad hoc surveys to capture data on the level of ‘mobilization’ going back to 2013. But a new standard that mainstreams the reporting, directly into the DAC Creditor Reporting System (CRS++) has recently been agreed upon (with guidance issued in 2016 and data expected to start flowing in 2017).
The results of the 2016 survey indicate that during 2012-2015 USD$81.1 billion was mobilized from the private sector by official development finance interventions.
Strengths and weaknesses
The range of coverage in terms of donors and types of instruments, and further socialization of key concepts and methods, are the two main contributions of the report. However, key concepts and methods are also where there are blind-spots.
What the DAC covers vs. what stakeholders are interested in
DAC guidance, and future data that will flow into DAC statistical systems as a result, are an outcome of long negotiations on what should and should not count, and how.
By virtue of its position, the DAC approach primarily deals with ‘official’ coverage. It can only mandate reporting from its members, official donor agencies. As a consequence, the process of arriving at final concepts and definitions has gone through contortions to fit with the given starting point, avoid double counting, and only focus on the attributable additional elements and causal linkages. This is one of the reasons that the DAC has settled on the concept of “mobilization”:
The term, “mobilization,” describes the causal link between private finance made available for a specific project and an official intervention. Causality means that the private financiers would not have invested in a development activity in the absence of the official sector mechanism/intervention. See here for details.
The DAC’s data will cover the following instruments:
- Guarantees or insurance.
- Syndicated loans (specified by role and position, whether participant or arranger).
- Shares in collective investment vehicles (CIVs) (again, specified whether in a flat CIV or riskiest tranche in structured vehicle, first loss, lock-up or other).
Other instruments, like eligible common equity, various mezzanine finance or hybrid instruments, debt instruments and asset-backed securities, will also be covered in future data (but are not in the survey).
As the use of these instruments and blended finance more generally grows, the above will shed important light on areas not well understood by most in the development sector. The DAC provides detailed guidance on valuation methods in each case (see details).
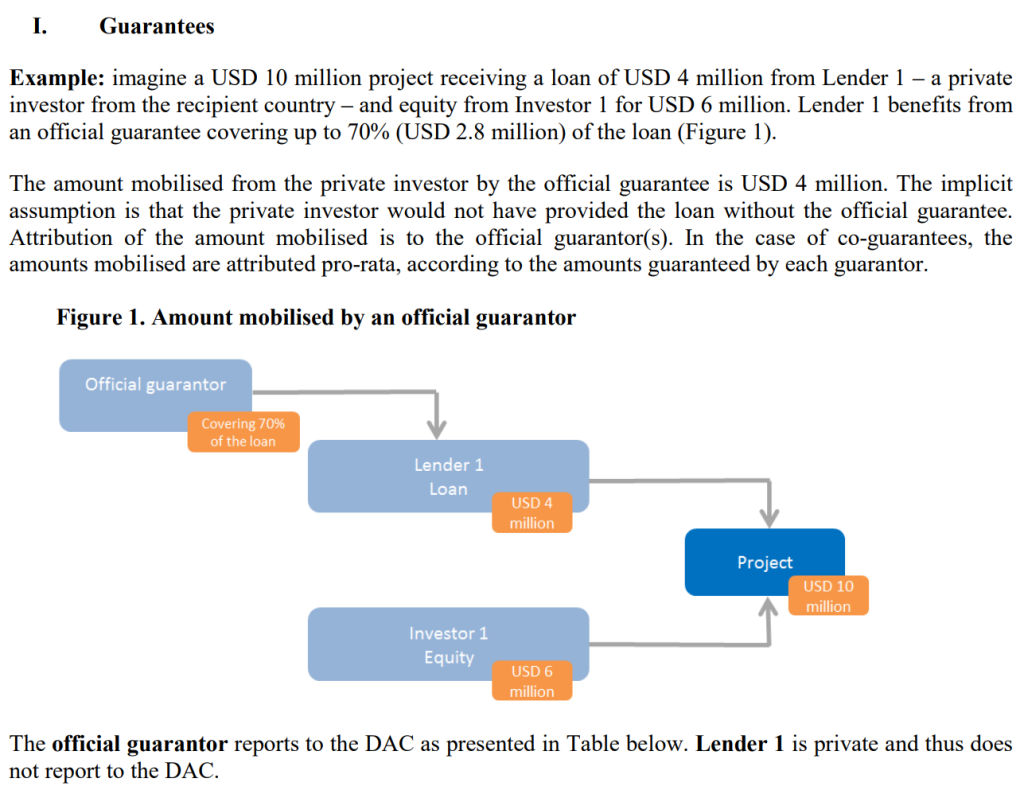
Figure 1. OECD-DAC guidance on valuation of guarantees
But it is likely that the current approach will fail to answer the question that is of most interest to policymakers, analysts and practitioners, which relates to the more standard concept of financial leverage.
What is the leverage that a given $1 in official finance achieves?
In the standard financial sense, if $1 is risked (say, by issuing a bond) to raise $2, then the leverage ratio is 2:1. This assumes knowing at least two of three things: how much we have at stake, how much we need to raise, and the total size of the deal.
But in the example the DAC uses in its guidance for guarantees (above), if we wanted to know how much leverage was achieved, we would not be able to do so as some aspects would be missing.
In the above, which is quite typical and a relatively simple example, the total amount ‘mobilized’ from the private sector would be reported as USD$4M. The key point is that neither Lender 1 nor Investor 1 report to the DAC. They are private players, the DAC cannot mandate them to report. Nor, however, is it clear that the total project size would be known.
All we would know is that the official provider, through a guarantee, mobilized USD$4M in private finance. From the standard as laid out at the moment, it is not apparent that the fact that the guarantee covers 70% of the loan Lender 1 makes would be reported either.
In effect, in the above example:
- The official provider’s VaR (value at risk) is USD$2.8M (70% of USD$4M).
- Taken against the loan Lender 1 makes, this implies a leverage ratio of approx. 1.4x (4M /2.8M).
- Or, given the presumption that Investor 1 will only come in with the USD$6M equity if Lender 1 is there first, the leverage ratio could be against the whole project i.e. approx. 3.5x (10M / 2.8M).
- Or, if we only know that USD$4M in private capital is ‘mobilized’ using official finance, and the total project size is USD$10M, then we are likely to conclude the leverage ratio is 2.5x (10M / 4M).
This certainly leaves some blind-spots that could cause confusion. And guarantees are the simpler mechanism. A CIV with different tranches and risk profiles for different investors would be much more complicated.
Survey findings for 2012-2015 show increasing coverage and growth
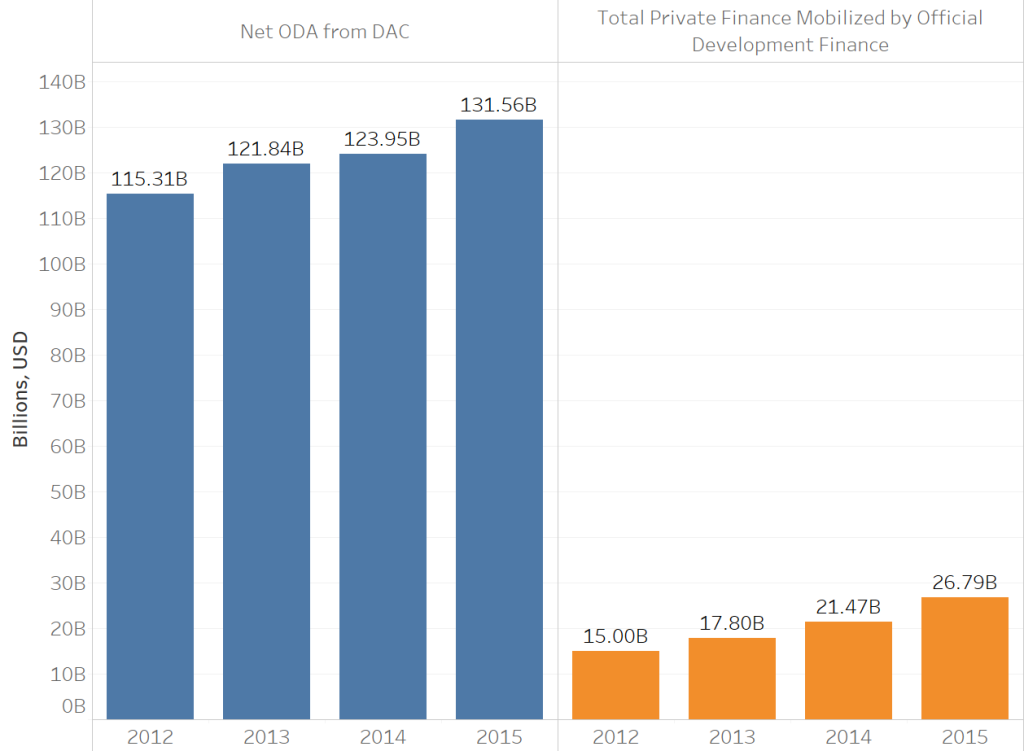
The above issues aside, and taking the DAC concept of mobilization at face value, the data indicate growth in private finance mobilized by official development finance from around USD$15B in 2012 to USD$26B in 2015.
Part of the increase has to do with expanding coverage (the IFC only started providing data on syndicated loans 2015 onward).
The total levels are small compared to net ODA, but are growing faster.
Figure 2. Private finance mobilized compared to net official development assistance (ODA)
Bilateral DFI’s are a big part of the trend
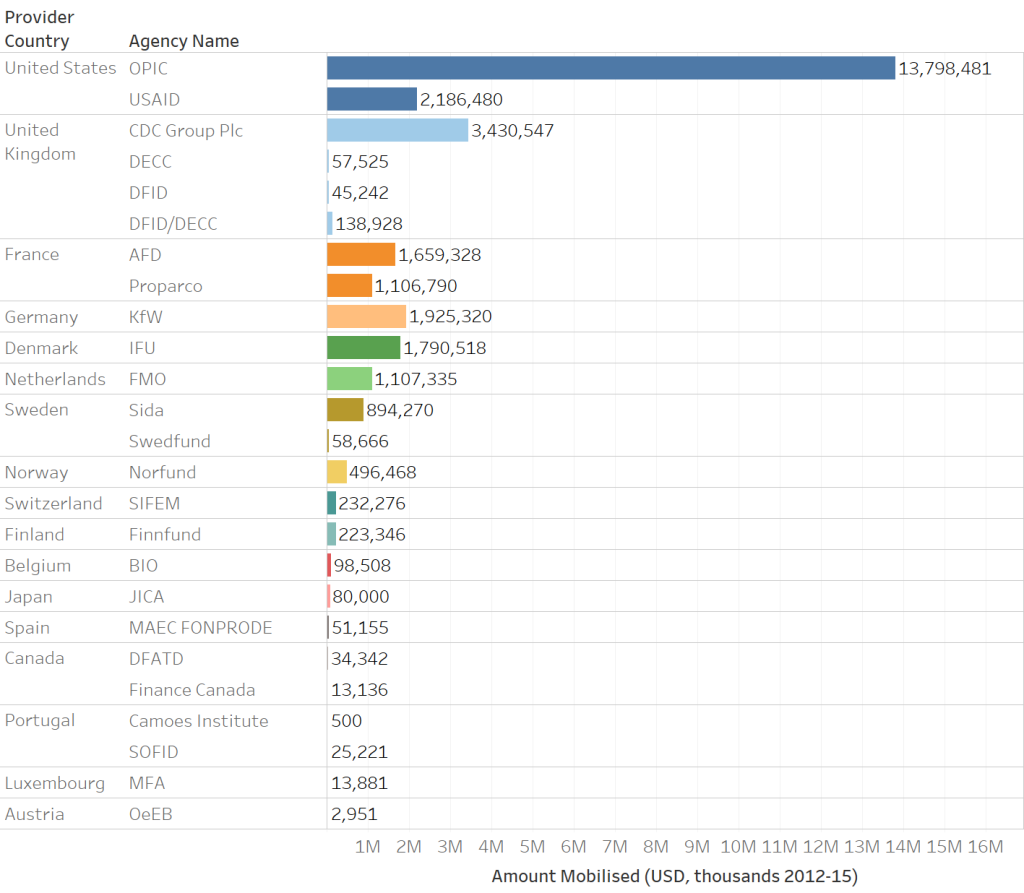
While multilaterals—EIB, MIGA, IFC, IBRD, World Bank group, regional development banks—are responsible for the bulk of the private mobilization (two thirds), bilaterals are playing a major role, primarily through their DFIs.
Among DFIs, the largest by far is OPIC (US), followed by CDC Group (UK), IFU (Denmark), FMO (Netherlands) and Proparco (France).
Figure 3. Private finance mobilized by bilateral agencies and DFIs
Guarantees are the largest leveraging mechanism by value
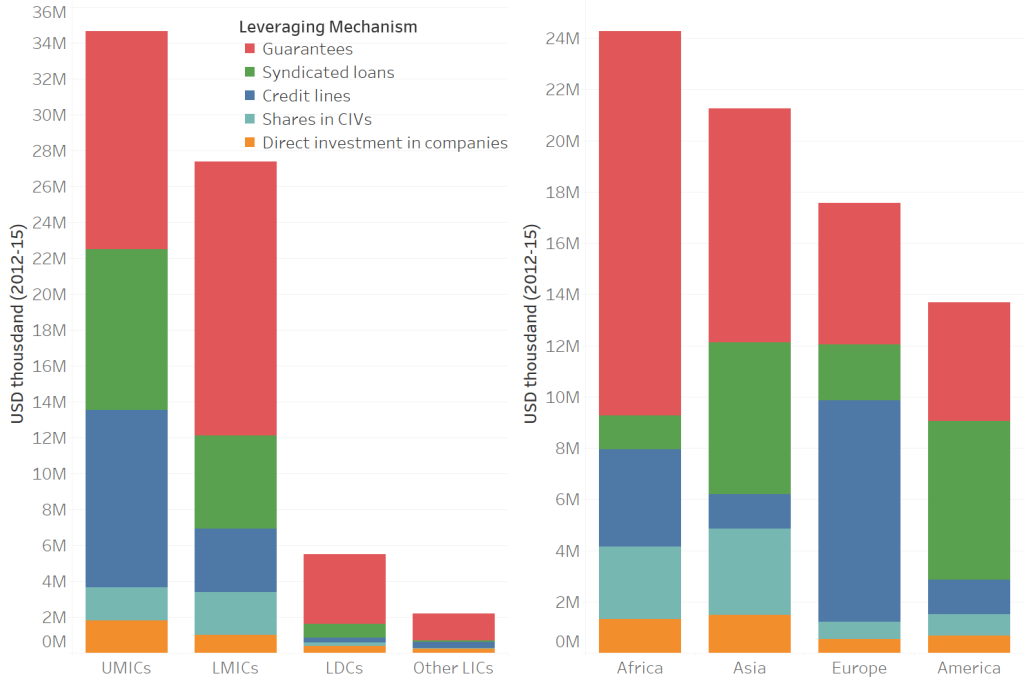
The 2016 survey confirms findings from past surveys that guarantees are by far the most important leveraging mechanism by value. They represented 44% or approx. USD$36 billion of the total private finance mobilized during 2012-2015.
Guarantees are even more important in poorer countries. They make up an even larger share in least developed, and other low income countries (see Figure 4 below).
The significant share of guarantees and the corresponding very small share of direct investment in companies as leveraging mechanism for private finance, especially in lower income countries, is a pattern a new DFI like the Canadian DFI would do well to keep in view as it develops its portfolio. It could be seen as a gap and therefore opportunity to go where others are not crowding, or the opposite: direct investment in companies at least in the poorest countries is too risky.
Only better data and analysis of the same can help address such questions. While the DAC survey and data help scratch the surface, they do not deliver enough granularity to carry out such analysis at the moment.
Most of the mobilized private finance goes to projects in middle income countries in Africa and Asia, primarily in the banking and energy sectors.
77% of the total private finance mobilized went to projects in upper and lower middle income countries. At 30% of the total private finance mobilized, Africa was the largest destination geographically—with Nigeria, Ghana, Kenya, South Africa and Cote d’Ivoire being the largest recipients, and guarantees being the largest mechanism in each.
33% of mobilization went to the banking and financial services sector, followed by 25% to energy generation and supply.
Figure 4. Leveraging mechanisms across income groups and regions
Canada’s position, for now, is minuscule in this space
As can be seen from Figure 3 above, Canada’s position in this area of development finance is minuscule. Between 2012 and 2015, only USD$47 million in total private finance was mobilized by Canadian official development finance, according to the OECD-DAC survey. Approx. USD$13 million of this was attributed to Finance Canada and was for climate finance (mobilized via a CIV). Further details are not known.
But, with the launch of the new Canadian DFI capitalized at CAD$300M over 5 years expected to begin deal flow in January 2018, this picture will change.
The real question is what these data and such reports mean for the Canadian DFI and Canada’s approach to development finance more generally. A few points can be surmised:
- Conceptually, the parameters of development finance are changing in significant ways.
- Private sector involvement as a source of mobilization and leverage, but also in other ways (know-how, partner in service delivery, pursuit of shared goals like job creation, economic development and growth) will only increase in importance.
- Concepts like ‘ODA’ are changing in important ways. ‘ODA’ has never been a fixed concept. It has adapted to new realities, which is a reason it is still relevant. But the most recent updates are important to take note of as they are significant.
- Starting in 2018 data, new differential discount rates will be applied to ODA valuation across income groups—UMICs 10% grant element at 6% discount rate; LMICs (15% grant element, at a 7% discount rate), LDCs and LICs (45% grant element, at a 9% discount rate).
- What does this mean? Two things are important. Income groupings and transitions across the same will matter more. ODA to poorer countries will count more generously towards headline ODA figures.
- This is different compared to the current approach where only the broad ‘ODA eligible list’ matters and differences across the income spectrum within that list do not matter at all for how ODA is counted.
- Private mobilization is increasing in importance, which is why the DAC is working to include it within its main statistical system.
- Bilateral DFIs are an increasingly important reason why.
- As countries develop and economies mature, their needs change, and the types of sectors DFIs and private finance tend to target (e.g. banking, SME finance, infrastructure) will increase in relative importance, especially from the perspective of the need for external development financing.
- New concepts and data standards are useful, but there are still shortcomings. The current approach to capturing amounts mobilized from the private sector by official development finance leaves gaps.
- For one, standard leverage ratios cannot be assessed, i.e. how much private finance a $1 in ODA or other official finance leverages is near impossible to know at the aggregate level (and only possible to know at the investment/project specific level provided there is greater transparency).
- That said, some of the patterns—such as the importance of guarantees as a leveraging mechanism including in the poorest countries, and the large share of the banking and financial sector—are revealing.
- A nuanced assessment of these patterns requires better data, but would be helpful in estimating both opportunities for a new DFI, if not also a sense of realism (sectors and mechanisms that are still too early), which would help guide expectations.
- The new Canadian DFI should aim to do better than the current standard especially in terms of transparency.


Recent Comments