
Quick overview of recently released comparative aid statistics from the OECD-DAC for 2016. Click on images below to see full page view.
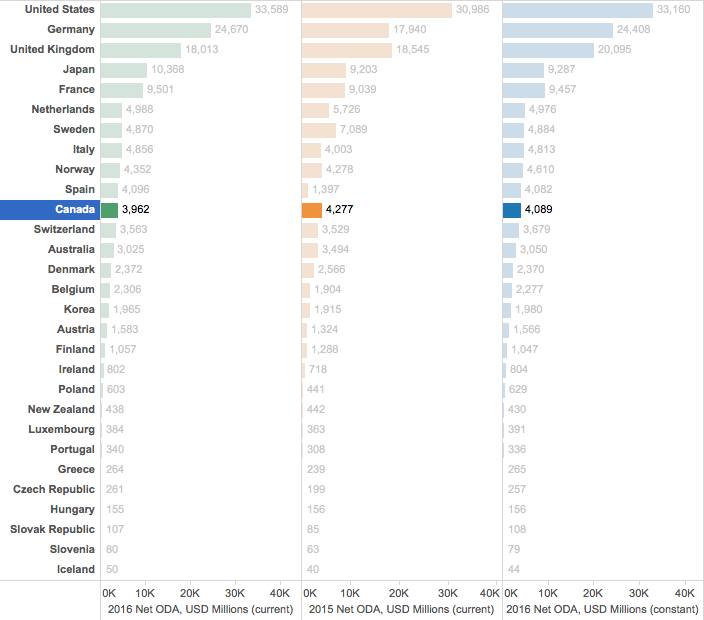
DAC Country Comparisons
(Click Image to Enlarge)
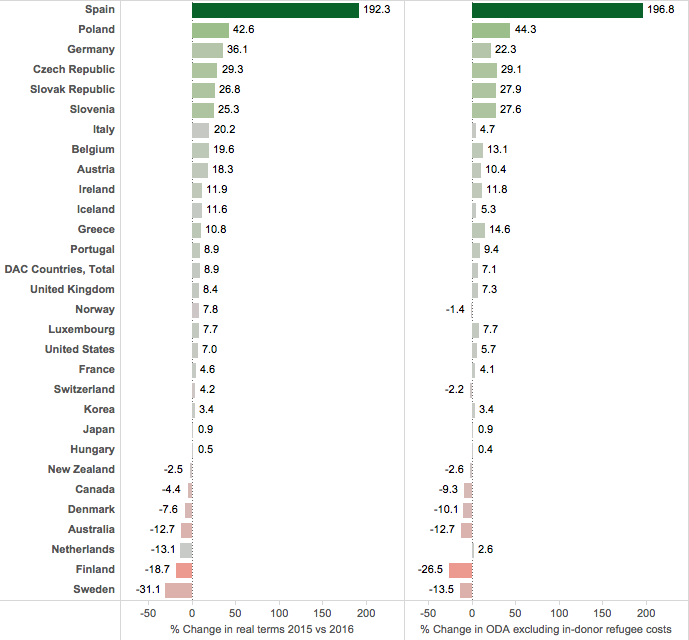
Key Year-on-Year
Changes
(Click Image to Enlarge)
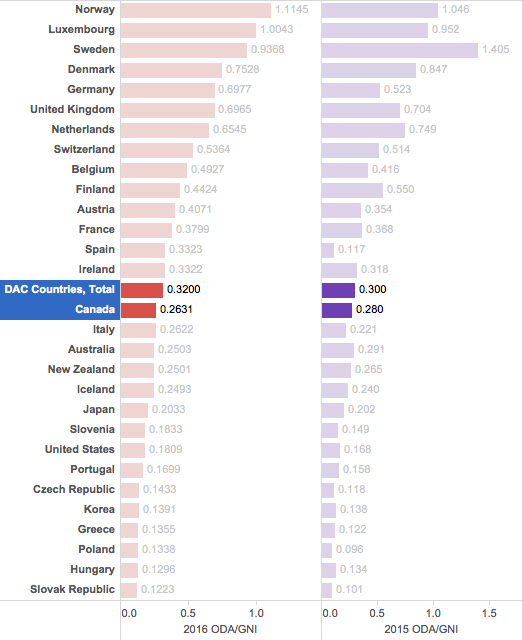
Comparative ODA and
ODA/GNI levels
(Click Image to Enlarge)
About
Total net ODA from OECD-DAC countries reached US$ 142.6 billion in 2016, in current US$ terms. This represents an 8.9% increase compared to 2015 (when accounting for inflation and currency exchange), putting ODA levels at an all time high.
According to the OECD-DAC, “ODA continues to grow and its volume in real terms has doubled since 2000”.
Story behind the numbers
In 2016, as in the prior year, large increases to in-donor refugee costs remain a main story across OECD-DAC donors. These costs include money spent inside donor countries for settling refugees, but according to DAC rules can be reported as ‘foreign aid’ (to a large extent the accounting is up to donor discretion).
Unprecedented inflows of refugees and migrants over the last two years have impacted ODA expenditures for DAC countries. The OECD reports that in-donor refugee costs rose by 27.5% in real terms from 2015 to 2016, with refugee costs now representing 10.8% of total net ODA. Large increases in ODA remain prevalent across major donors including: Germany, Italy, Norway, Sweden and Switzerland. In each case, spending on refugees account for more than 15% of total ODA,
About the data and source
For more, please visit the OECD-DAC aid statistics page. See also, the DAC’s narrative summary.
Download our clean, summary version of the data used above. (MSExcel)
Canada in the OECD-DAC (preliminary)
The main objective of this quick preliminary analysis is to reflect on the data from the perspective of where Canada stands relative to OECD-DAC donors.
- Canada’s aid totalled approx. US$ 4.09 billion in 2016, if viewed in 2015 prices and exchange rates.
- This compares with approx. US$ 4.28 billion in 2015
- Canada’s ODA, in real terms, decreased by 4.4%, 2015 vs 2016
- Canada’s ODA/gross national income (GNI) ratio now stands at 0.26% — down 0.02% from 2015.
- This puts Canada’s ODA/GNI ratio well below the OECD-DAC average of approx. 0.32%.
- In volume terms, Canada now ranks as the 11th largest OECD-DAC donor – Canada’s rank has moved down two places since 2015.
- By comparison, in 2012 Canada ranked the 6th largest OECD-DAC donor, in 2013 Canada ranked 9th, in 2014 Canada’s rank fell to 10th.
- Based on the ODA/GNI ratio Canada now ranks 15th among the 29 DAC members, down from 14th in 2015.
- In 2016, refugee costs composed almost 10% of Canadian ODA.
This is a preliminary analysis of headline figures, which provide only a partial sense of Canada’s wider contribution to international development.
The story behind Canada’s numbers
In 2016, refugee costs became a significant component of Canada’s ODA. As a share of net total ODA, Canada’s in-donor refugee costs almost doubled from 5% in 2015 to 9.9% in 2016.
The OECD reports that without refugee spending, Canada’s ODA decreased by 9.3% in 2016. In real terms, this puts Canada’s ODA slightly below 2014 levels. Without refugee costs, Canada’s ODA/GNI would have been between 0.24% and 0.25%.
Recent Comments