by Aniket Bhushan and Rachael Calleja
Published: April 11, 2017
This analysis is based on preliminary OECD-DAC data from the April 2017 update. The analysis further validates our findings based on Canadian data released earlier.
The OECD-DAC headline: ODA rising, but with caveats
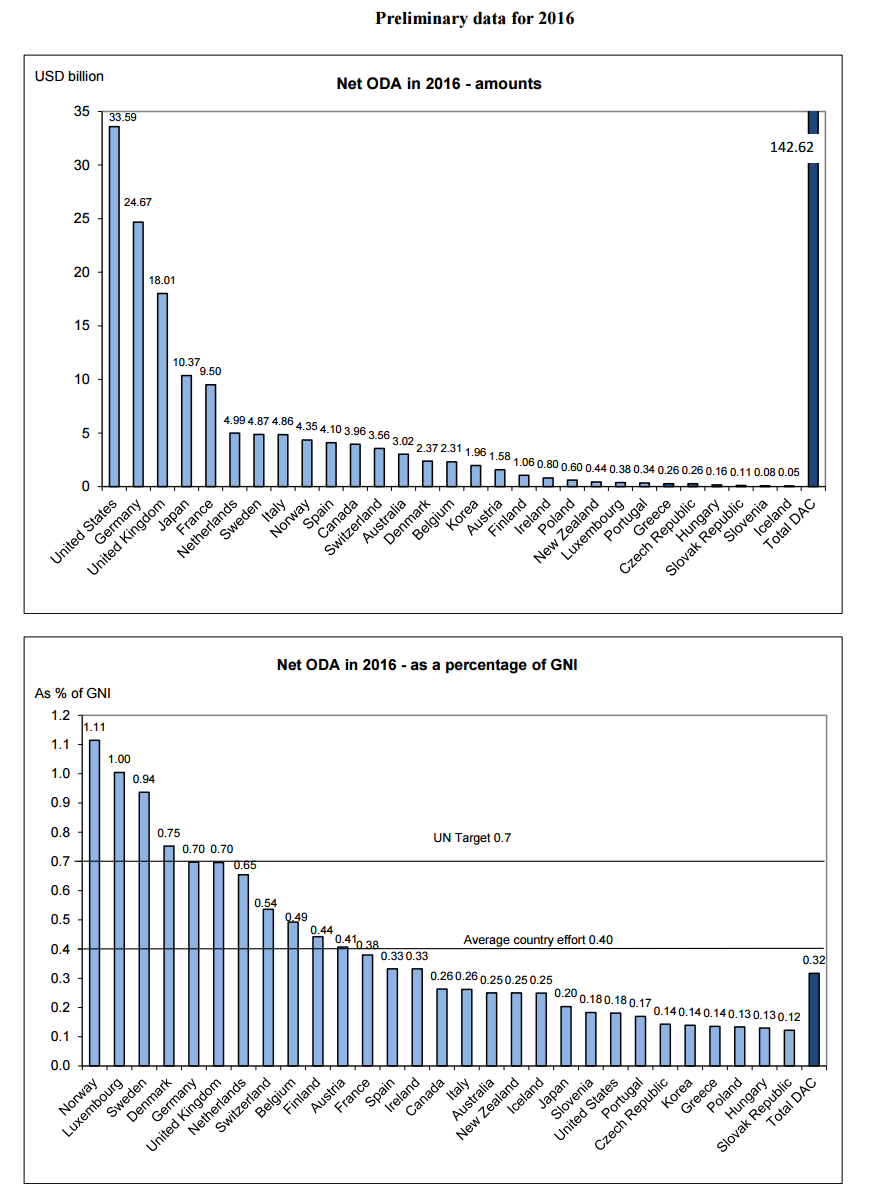
- All time high: ODA from DAC members reached $142.6 billion in 2016. An increase of around 7% (even accounting for exceptional in-donor refugee costs).
- Not for the poorest: However ODA or foreign aid to the poorest countries continued to decline. Aid to Least Developed Countries fell by approx. 4% in real terms compared to 2015.
- Refugee costs: Large increases in refugee costs reported as ODA across major donors, including: Germany, Italy, Norway, Sweden and Switzerland. In each case in-donor refugee costs account for over 15% of ODA. In some cases, like Germany, the second largest global aid provider in 2016, refugee costs are now over 25% of German ODA, a sharp increase over the previous years and continuing the trend in recent years since the refugee crisis in the MENA region.
Canada: ODA/GNI falls (as expected), lower than OECD-DAC averages
- Canadian ODA: total reported for 2016 in US$ (and calendar year basis) which make the data different from Canadian sources, was $3,962 million (as compared to CAD$5,280.98 million).
- ODA/GNI: Canada’s ratio falls, as predicted, to 0.26.
- Comparative: Canada’s ODA/GNI ratio is lower than the OECD-DAC average which is 0.32 and far below the average country effort which is 0.40.
- Canada’s rank: on an absolute basis, Canada’s rank among DAC donors drops to 11th. Partly because 2016 figures correct for exceptional one time reporting that inflated 2015 figures, and partly because some donors jumped ahead on account of exceptional debt relief (e.g. Spain sees a near 200% increase in ODA, but, due to debt relief for Cuba). Canada’s rank also falls on a relative basis using the ODA/GNI ratio, to 15th, out of 29 DAC donors.
- Refugee: again, as predicted and was already indicated by Canadian data, refugee costs are now having a major impact on Canadian ODA figures. Nearly 10% of Canadian ODA in 2016 was spent within Canada on refugee settlement. Much of this is a function of the first year costs of the settlement of Syrian refugees in Canada. The figure represents a near doubling compared to the previous year.
- Net of the increase attributable to refugee resettlement costs Canada’s ODA/GNI ratio would have been between 0.24 and 0.25.
- Canada’s share of total DAC aid: the above implies Canada provides roughly 2.7% of total DAC aid.
The 0.7 club
There are now 6 countries that meet the 0.7 % ODA/GNI target:
- Norway: 1.1%
- Luxembourg: 1%
- Sweden: 0.94%
- Denmark: 0.75%
- Germany: 0.7%
- UK: 0.7%
In all cases, with the exception of Luxembourg and the UK, refugee costs represent a significant share of ODA, between 17% and 25%. If refugee costs were excluded, both Germany and the UK would not meet the 0.7 target.
The G7 club
How does Canada compare with the other G7 countries? ODA/GNI ratios alongside total ODA levels in 2016 are given below:
- Germany: 0.7 and $24.6 billion
- UK: 0.7 and $18.0 billion
- France: 0.38 and $9.5 billion
- Italy and Canada: both 0.26; $4.8 billion and $3.9 billion respectively
- Japan: 0.2 and $10.3 billion
- US: 0.18 and $33.5 billion
Canada is the smallest aid provider among the G7 in absolute terms. In relative terms, using the ODA/GNI aid generosity index, Canada ranks in the middle of the pack within the G7, exactly as it did in 2015. It will be interesting to see how Canada’s performance fares in the next year as it gears up to host the G7 in 2018.


Recent Comments