
by Aniket Bhushan
Published: February 15, 2017
The key takeaway from Prime Minister Justin Trudeau’s first meeting with his US counterpart can be summed up in one word: “…phew!”
A lot could have gone wrong, but by all accounts did not. This is a major achievement being widely celebrated across the Canadian media with due credit going to the Prime Minister’s artful dodging.
While recognizing the over $2 billion in daily cross border trade between Canada and the US, the formal statement notably made no mention of NAFTA. The US president’s response during the Q&A was arguably the biggest win for Prime Minister Trudeau:
— US President, Donald J. Trump
This analysis unpacks the “very outstanding trade relationship” by way of a basic primer on Canada’s trade footprint.
The Big Picture
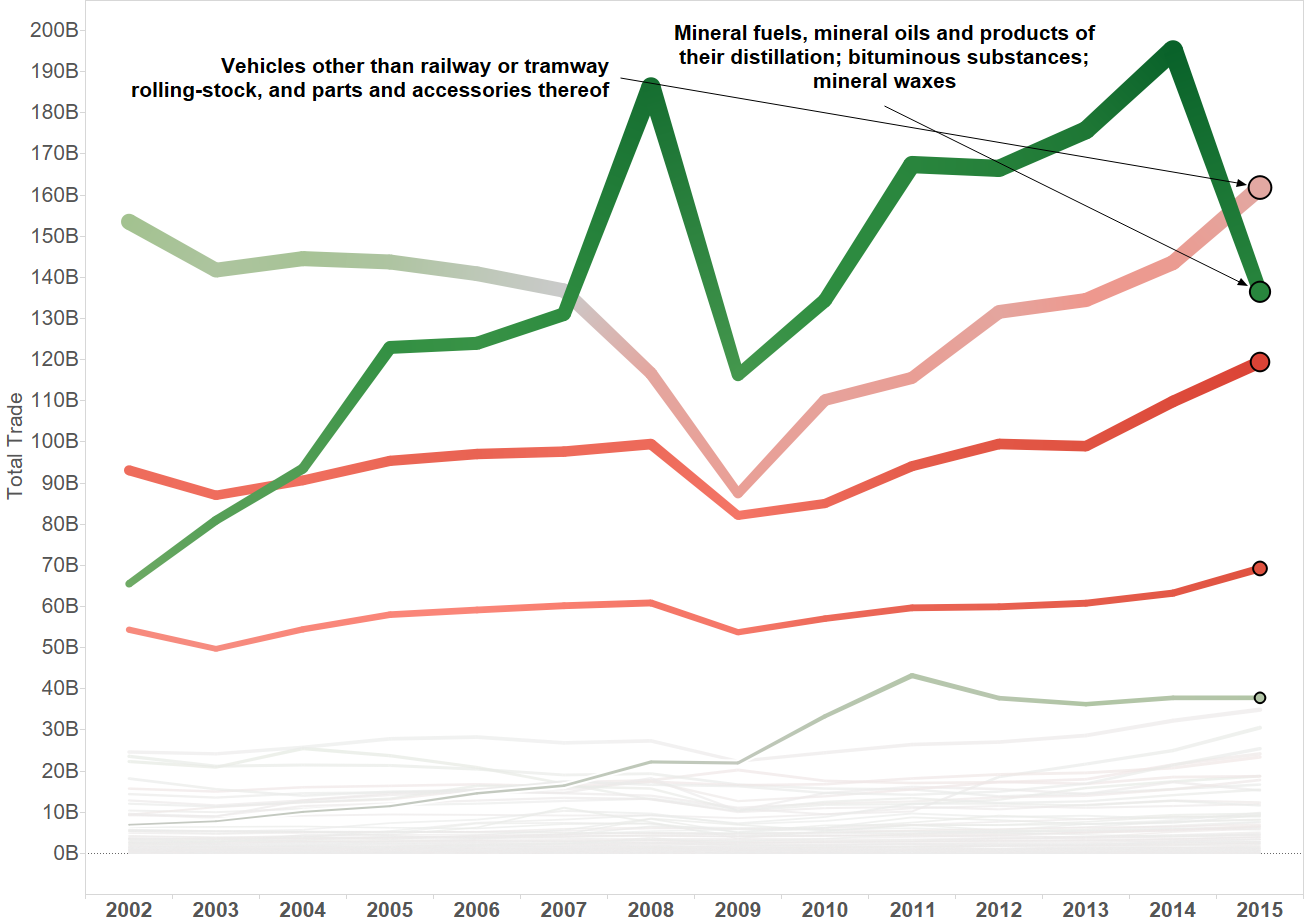
The graph below looks at both the trend of Canada’s total goods trade (exports + imports) and trade balance. Given how integrated global supply chains are and because much of bilateral trade is in intermediate (as opposed to finished) goods it makes sense to look at the total picture. All figures are in Canadian dollars and from our trade data portal (which is based on the Canadian International Merchandise Trade database), unless specified.
Canada’s bilateral trade: overall trend and balance of trade
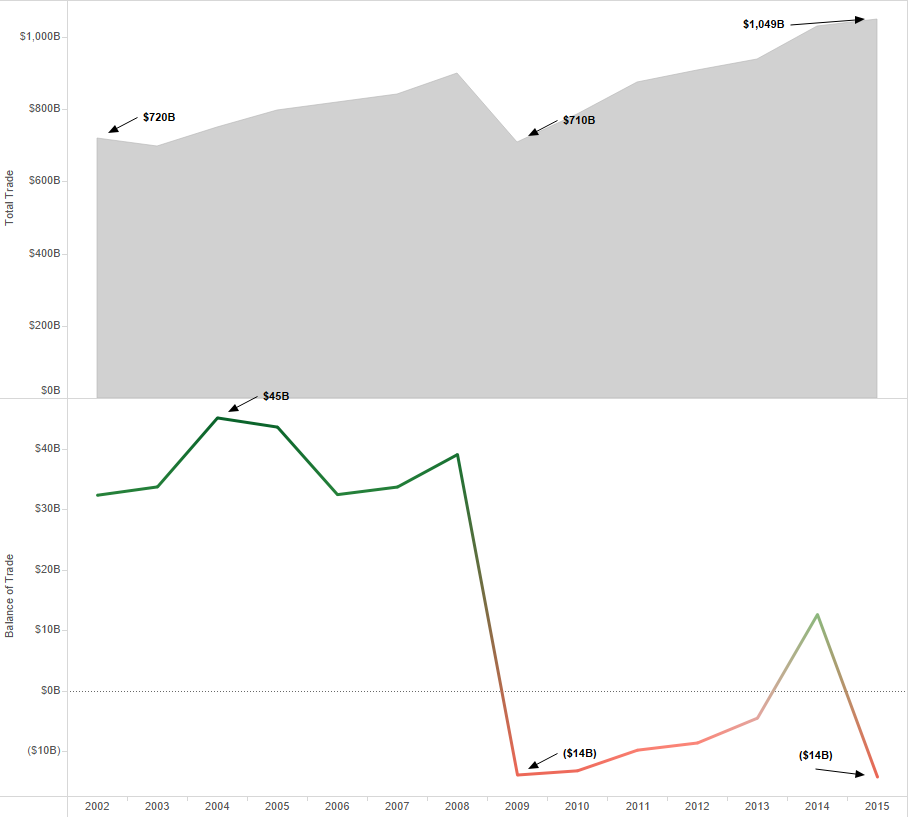
Take-away(s):
- Canada’s trade, like most other advanced economies, contracted sharply in the 2008 crisis, but has since fully recovered to levels higher than past highs (nominal terms). Total trade is now over $1 trillion.
- However in Canada’s case the recovery has come with a worsening trade balance, i.e. growing trade deficits, which ended the year above the -$10 billion level in 2009 and 2015.
- The key reason behind this is the price of oil. While trade volumes have been relatively stable, total trade in value terms has been volatile.
Below we look at trade concentration. The data are from UN-Comtrade and US$ to allow comparison. The view shows total trade with a given partner as a percentage of overall total trade (2015). How does Canada’s trade concentration compare with that of other advanced economies?
Trade concentration: comparison with select partners
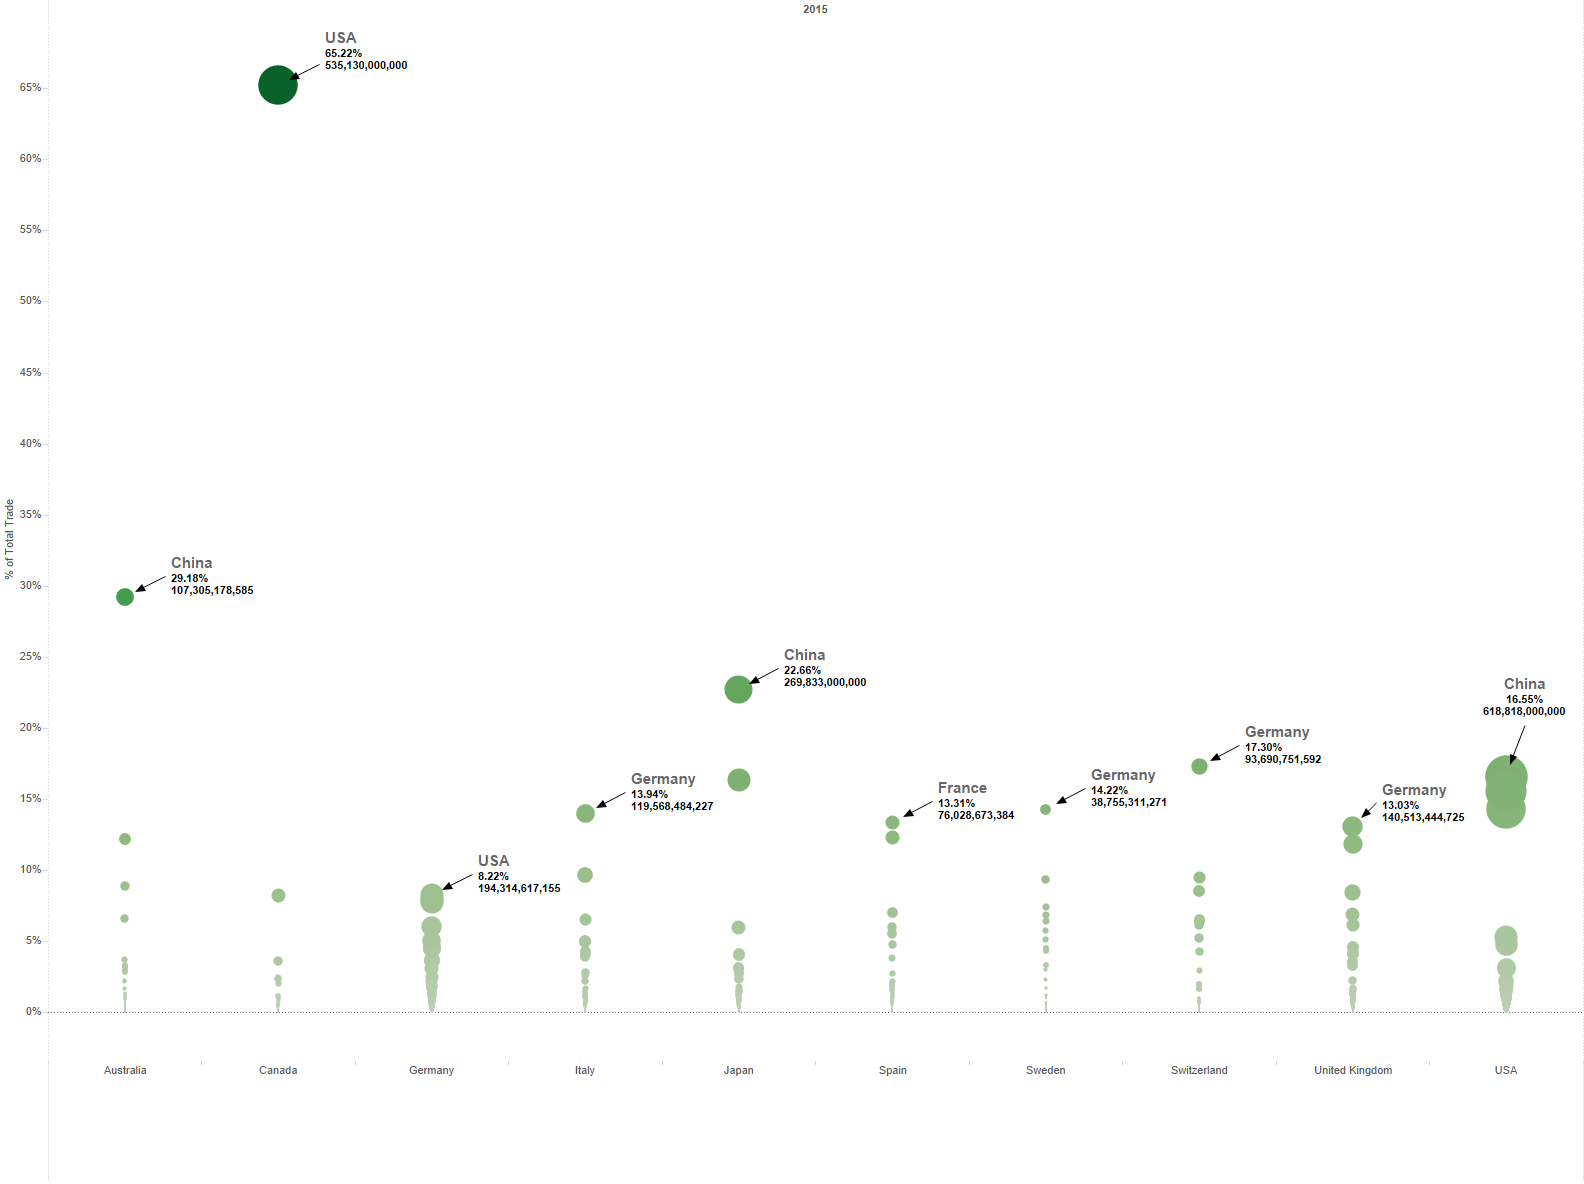
Take away(s):
- Advanced economies tend to trade more with one another. Their supply chains are more integrated and their specializations tend to be complementary (each has what the other needs). China’s rise and key role in global supply chains is another important facet that comes across above.
- For many countries trade tends to be highly concentrated – the Swiss trade far more with the Germans than with others, as do the Swedes and Italians; Japan’s largest trade partner by some distance is China, for Australia trade with China is even more significant at nearly a third of total trade, more than double the next largest partner.
- Canada’s trade concentration however is off the charts. Of the major global bilateral trading relationships the Canada-US relationship is one of the most integrated. Trade with the US accounts for around 65% of Canada’s trade – a figure more than double the level of concentration of any other major bilateral relationship shown above. Trade with the US is about 8 times as large as the next largest Canadian trade partner (China, at approx. 8%).
- The only other major trading relationship that comes close is Mexico-US, where the US accounts for approx. 64% of Mexico’s total trade.
A Deeper Look
Lets breakdown what Canada trades with who and how this has evolved. The data below are at the HS2 product level, and in Canadian dollars. Total trade per product area and the share each product makes up in Canada’s total trade are shown. The trend graph that follows shows how total trade and trade balances per product area have evolved (the darker the green the greater the surplus for Canada, the darker the red the greater the deficit for Canada).
What Canada Trades (2015)
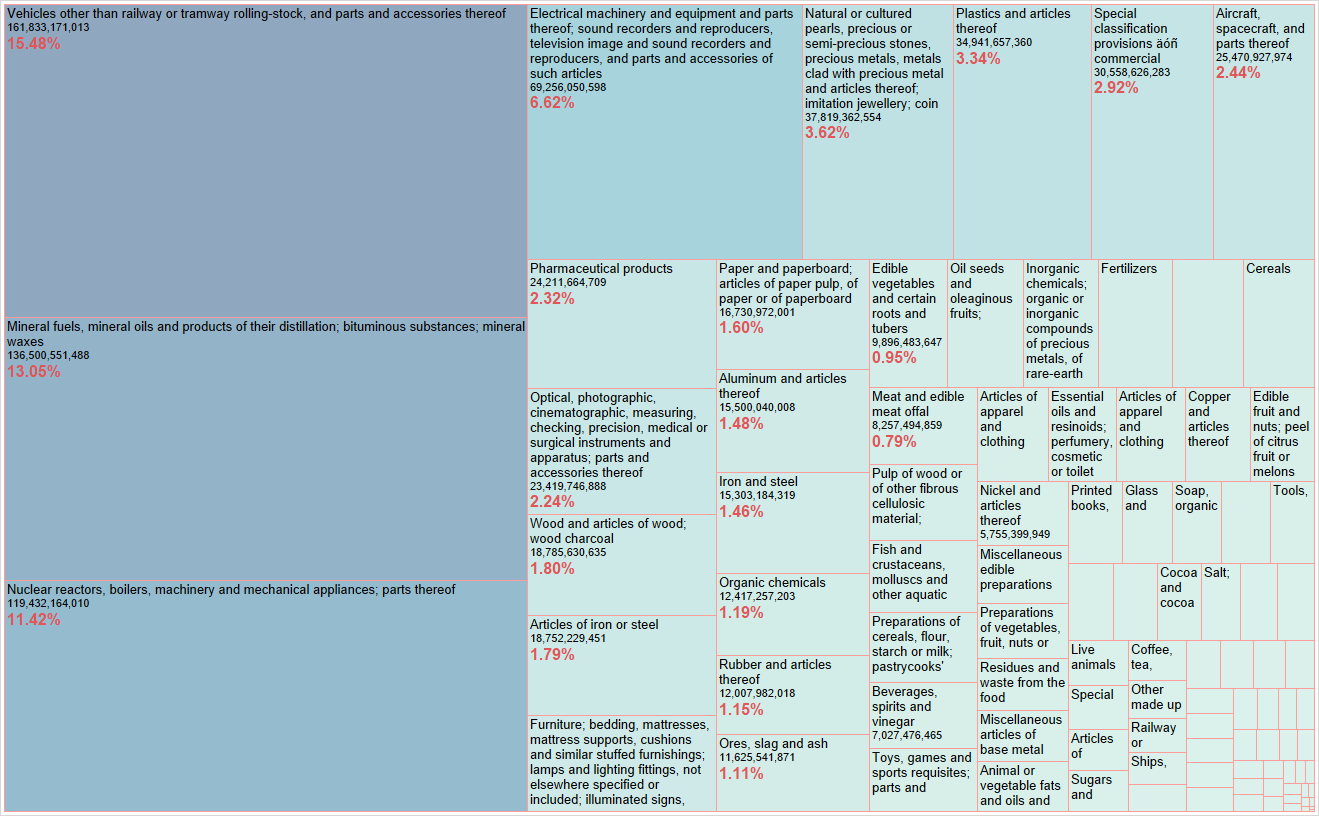
Total trade and trade balance by product areas
Take-away(s):
- Canada’s trade is highly concentrated in terms of its product mix. The top 5 product areas (HS2) account for over 50% of total trade. In 3 out of these 5 areas Canada tends to run a consistent deficit.
- The top 5 areas include: vehicles, mineral fuels including oil, heavy machinery and industrial equipment (including nuclear), electric machinery and equipment (which includes consumer electronics), and precious metals and stones.
- Most major areas tend to stay consistent in terms of whether they add to the trade surplus or deficit.
- The only exception among major areas in recent years has been vehicles. In 2002 on total trade of around $150 billion Canada had a surplus in vehicles of around $18 billion. In 2015 on total trade of around $160 billion Canada had a deficit of around -$8.5 billion.
- Among major products, mineral fuels and oil are not only the largest (and fastest growing) area within Canada’s trade over this period, but also the main factor driving the overall trade balance.
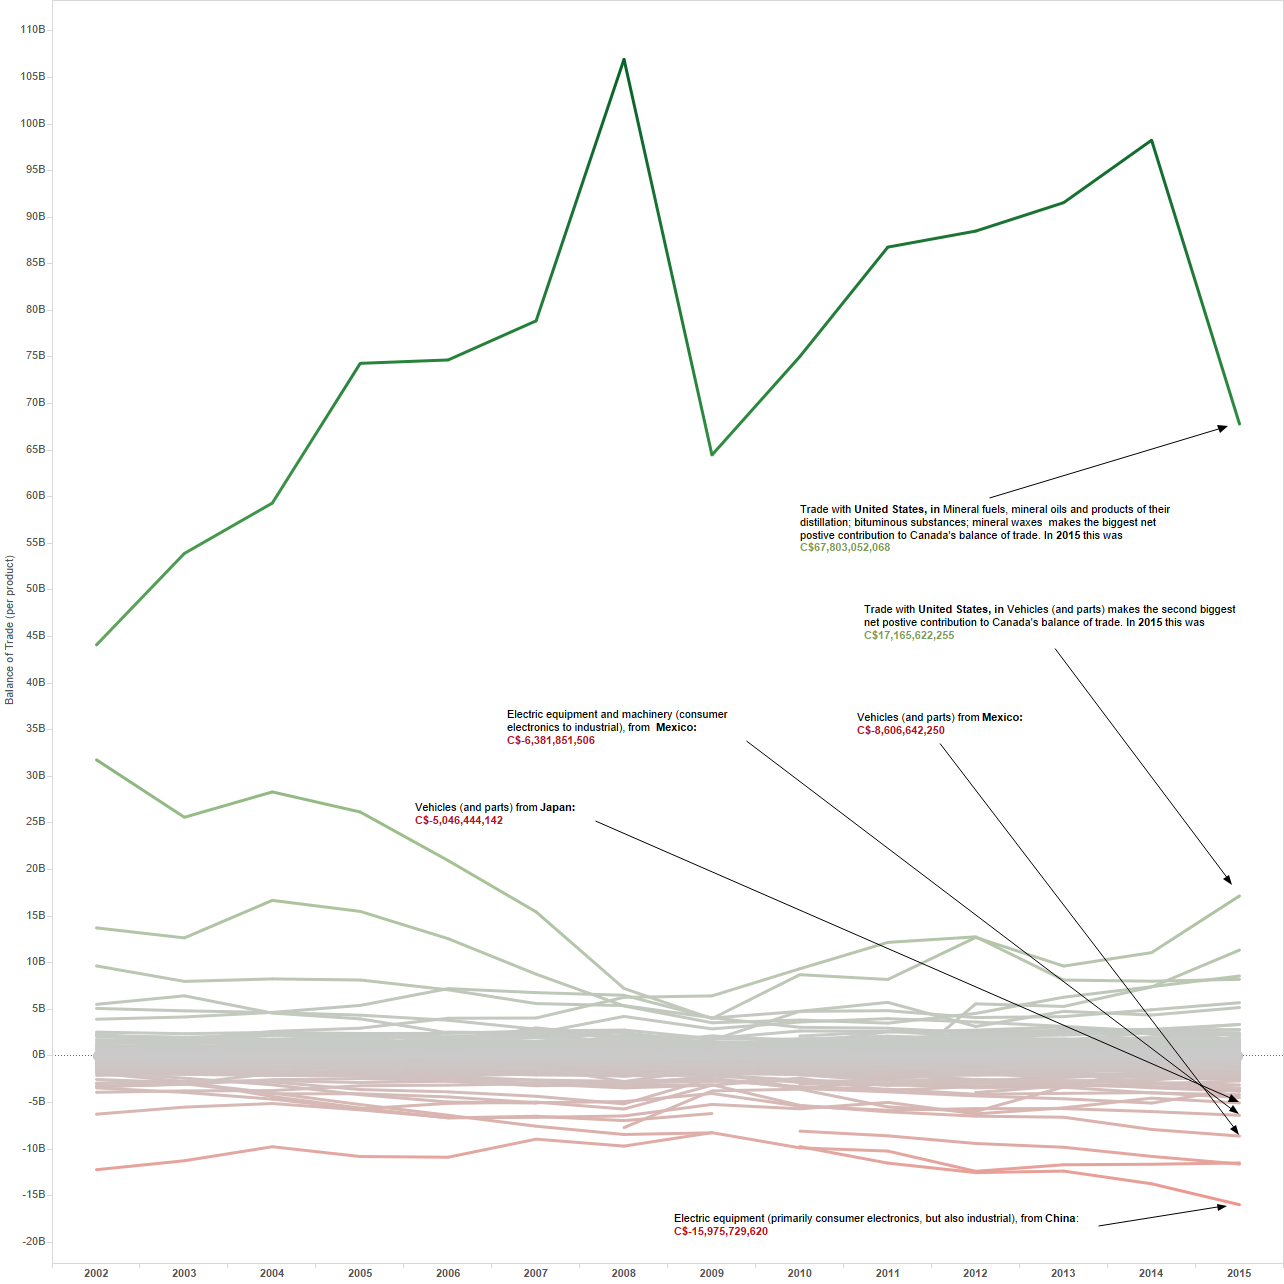
Lets look more closely at how the product mix has evolved by product area and trade partner. The next two graphics breakdown the product mix by balance of trade in each specific product area, and further by trade partner. The darker the green, the greater the surplus for Canada; the darker the red, the greater the deficit for Canada.
How the product mix has evolved
The data below hone in further on the 2015 product mix. Everything remains the same as above, except the circles are sized to reflect the total trade value: the bigger the circle the larger the total trade value in that particular area with the given trade partner.
Honing in on the 2015 mix
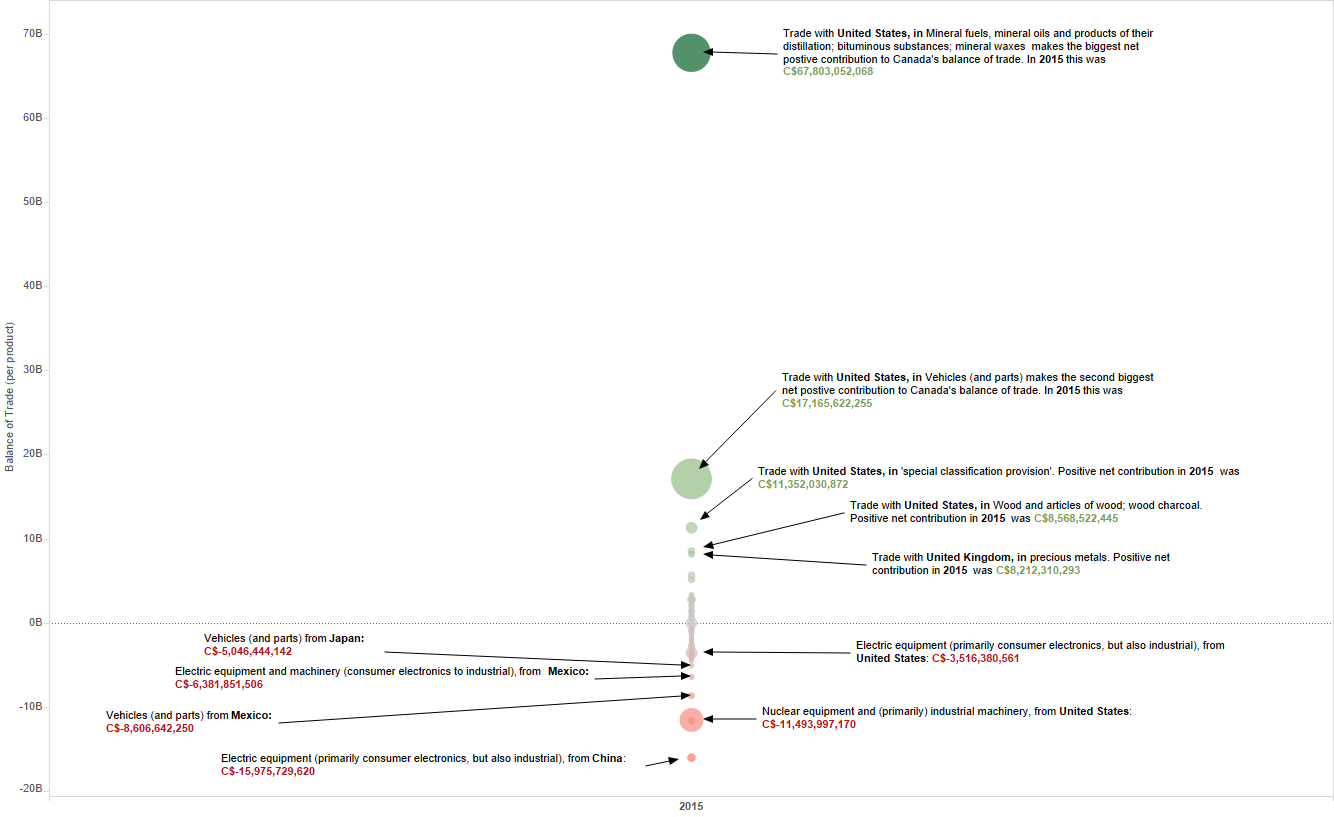
Take-away(s):
- Trade with the US is by far the largest positive contributor to Canada’s trade balance. While trade with China is the largest contributor to deficits.
- Canada sells oil, vehicles (and parts), other natural resources (wood), and precious metals, primarily to the US and a handful of other major partners with whom trade balances are consistently positive, to finance purchases of electric equipment including consumer electronics from China, followed by industrial equipment from the US and China, vehicles from Mexico and Japan, and electrical equipment and consumer electronics from the US and Mexico.
- Notice that while the balance of trade in vehicles with the US has remained positive, its level in 2015 (+$17 billion) was nearly half what it was in 2002 (+$32 billion).
- Yet the trade surplus in vehicles with the US was not enough to avoid an overall deficit (-$8.5 billion) in 2015.
- The explanation lies at the other end of the spectrum, in red, where some of the largest deficits for Canada are in vehicles with countries ranging from Mexico to Japan to Germany and S. Korea.
The $1 billion+ club
At the HS2 level, there are 98 key product groupings. Of these, total trade for Canada was over $1 billion in 71 areas (2015). The graphic below is limited to only include and highlight bilateral trade partners with which Canada’s total trade was over $1 billion. This gives us 63 product areas. All data are in Canadian dollars.
Product areas and bilateral trade partners, where total trade in 2015 was at least $1 billion (at the HS2 level)
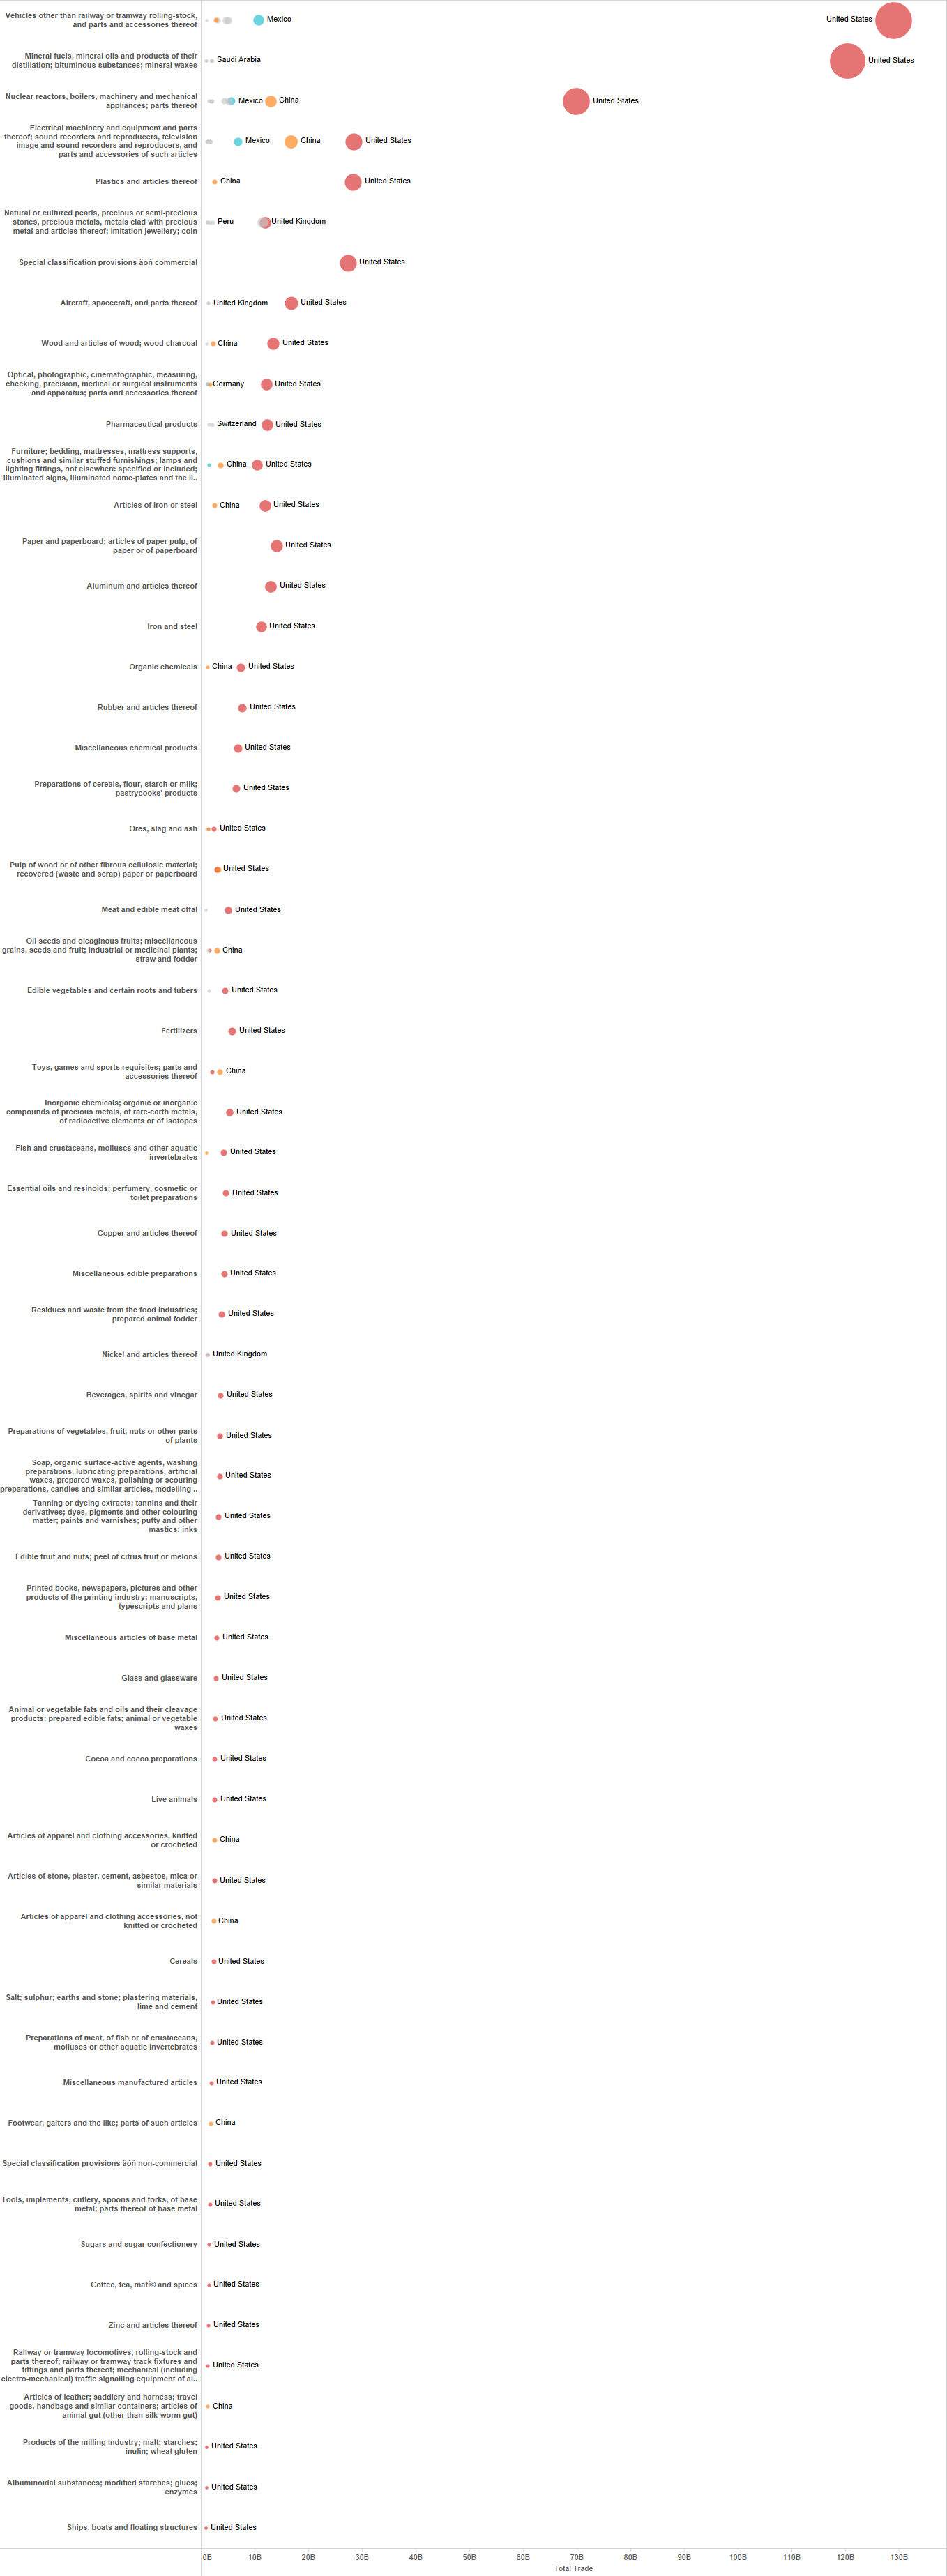
Take-away(s):
- The picture above is an important illustration of the overwhelming importance of the US for Canada.
- Of the 63 product areas above the US is the largest trade partner for Canada in 55 areas, in most cases by some distance.
- Of the remaining 8 areas, China is the largest trade partner for Canada in 7, and the UK in the remaining 1 (in 2015). Notably, these areas tend to be relatively lower value added consumer products or primary goods (oil seeds, wood pulp, apparel and clothing, footwear, leather goods – where China is the largest partner; in the case of Nickel the UK is the largest).
- In fact product areas that are more diversified in terms of trading partners, tend to be in the natural resources segment (case in point precious metals and stones).
The Fourth Pillar: higher value added goods and value added services
There are increasing calls for a much needed “fourth pillar” of the Canadian economy “based on a diversified spectrum of higher value-added goods [and] value-added services”. These remarks from the CEO of one of Canada’s largest banks (CIBC) are also echoed by the Minister of Finance’s Advisory Council on Economic Growth. Both reach the same conclusion: Ottawa should focus on more trade deals, including with China, India and Japan (which at the moment account for 8%, less than 1% and less than 2.5% of Canada’s total trade respectively).
What does the pattern look like in higher value added areas and for services trade?
- The above data indicates that in higher value added areas Canada’s trade at present is dominated by the US.
- The US accounts for about 80% of Canada’s total trade in vehicles, 60% in industrial equipment (including nuclear), 66% in aircraft and aircraft parts, over 50% in pharmaceuticals.
- Building trade competency in the US market after all has long been key to Canadian businesses’s globalization strategies.
- The path to product-wise diversification into higher value added areas, including in sunrise sectors like clean tech and green energy, is likely one that goes through the US rather than around the US.
- What about services trade? It is worth noting that Canada’s services trade, while important and growing, and certainly a major part of any future strategy, at approx. $235 billion (2014) is about a quarter of goods trade. (Not shown above, but based on analysis of UN-Comtrade data).
- Here again the pattern is dominated by a handful of sectors (travel, business services including finance, transportation, royalties and licensing fees) and even more so by the US and a few other advanced economy partners.
How the three amigos have gotten on
The election of Donald Trump has brought into question one of the bedrocks of Canada’s trade: the North American Free Trade Agreement (NAFTA). President Trump has inconsistently, and arguably incoherently, called for everything from entirely scrapping NAFTA, which he has the power to do (and has already done in the case of the Trans Pacific Partnership) to ‘tweaking’, to a double standard that would see major changes as far as Mexico is concerned but only minor tweaks for Canada.
Further confusion and uncertainty stem from the proposed “border tax” which could see a 35% tariff on imports into the US. If or how that may play against existing agreements like NAFTA, whether it will happen, whether it is allowable under WTO rules, remains a matter of speculation.
The first Trudeau Trump bilateral did little to clarify in this regard.
Neither the application of these changes nor their resultant impact will be straightforward or consistent. This is clear from related developments. For example, in one of his first executive orders the President reopened the possibility of the Keystone XL pipeline. More recently however the President has contended that the pipeline may be built on the condition that it complies with ‘buy American’ provisions (the steel used in its construction must be American).
That pipeline, along with the two others Prime Minister Trudeau has approved domestically at his discretion – Kinder Morgan and Enbridge’s expansion – add approx. 1.8 million barrels per day of crude export capacity, enough to handle Canada’s growing oil production for the next 20 years. Much of that export going to the US.
So in other words, while trends in one direction – whether a fundamental rethink of NAFTA or a slight tweak – might suggest diversification of Canada’s trade away from the US, and coupled with the pursuit of new deals with more like-minded partners elsewhere (e.g. CETA with Europe, or future deals with China and India as suggested by the advisory council) may suggest diversification product-wise as well as geographically, a singular executive order because it comes from the most important trade partner, has immediate and direct application in the most important area of Canada’s trade, portends the exact opposite.
Speculating about these scenarios is beyond our purview. We can however take a simple comparative look at how significant trade is for the NAFTA three amigos, how this has evolved, and how much they matter to one another.
How significant is trade for the three: a simple comparison
How much do they matter to each other
Take-away(s):
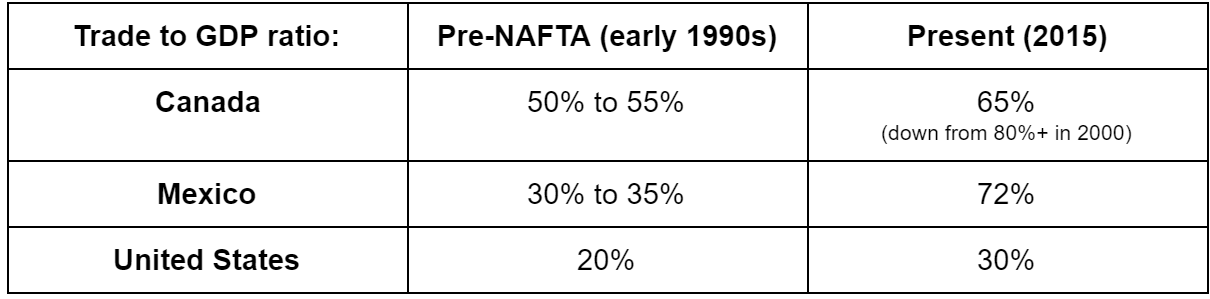
- This simple comparison is first based on the trade to GDP ratio (from the World Bank). The ratio provides a sense of how important trade is for an economy.
- Intra-regional trade between the three countries has increased over 400% since NAFTA. Compared to the pre-NAFTA early 1990s, the trade to GDP ratio has increased for all three countries, but the increase is greatest for Mexico, and the lowest for the US.
- In the case of Canada the trade to GDP ratio went as high as over 80% in the early 2000s but has since contracted to the present level around 65%.
- Trade matters to every economy. Relative to economic size however, trade matters much more to Canada and Mexico, than it does for the US.
- In fact the US trade to GDP ratio (due to the very large denominator no doubt), at just under 30% in recent years, is lower than the global average, lower than the average for OECD countries, and lower than the average for high income economies.
- It is not unreasonable to suggest NAFTA probably did more to increase the importance of trade for Mexico and Canada by further integrating them into the US, than it did to increase the relative importance of trade for the US.
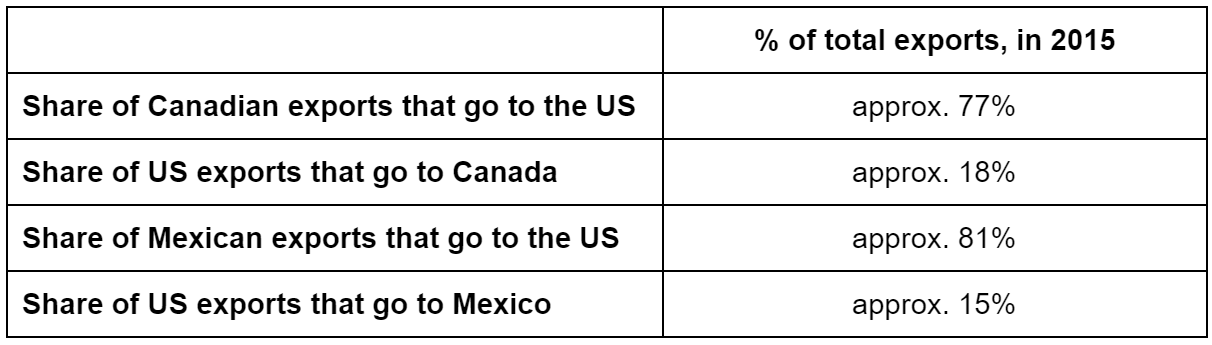
- Another take-away is regarding how much the NAFTA countries matter to each other from an export perspective. Access to the US is extremely important for Mexico as over 80% of its exports go to the US. The case for Canada is similar as around 77% of its exports go to the US.
- The situation for the US is very different however as only about 15% of its exports go to Mexico and about 18% to Canada.
- That still makes Canada the US’s largest export market and Mexico the second largest. In fact the level of US exports that go to Canada and Mexico is more than double that of the next largest US export destination, China.
- Canada, which has also long been the US’s largest partner in terms of total trade, lost this position only as recently as 2015 to China.
- While NAFTA remains one of the most integrated trade zones in the world, the fact that China is already a more significant trading partner for the three amigos than they are for each other, is an underappreciated reason, among others, for rethinking the basis and objectives of the grouping.
A “much less severe situation”
The key phrase from President Trump that Canada has been hanging on is that trade with Canada for the US is a “much less severe situation” than what is taking place on the southern border with Mexico. Was this just another throw-away line or is it backed up by numbers?
Trade balance: from a US perspective
Take-away(s):
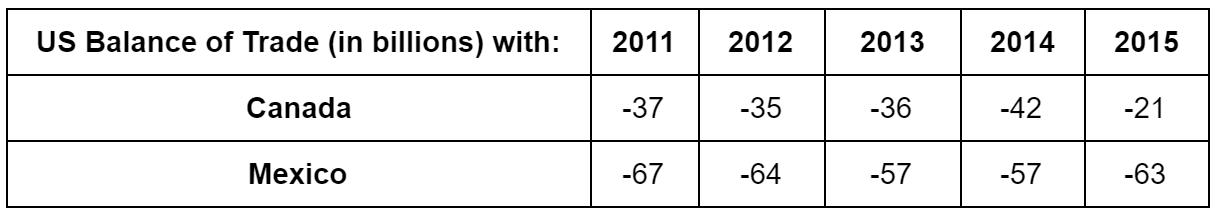
- From a US perspective the balance of trade (based on UN-Comtrade data and in US$ above) with both Canada and Mexico is consistently and substantially in deficit. The level of that deficit with Canada, in recent years, is much smaller than with Mexico. (For reference, the US deficit with China is of course much larger, more than 6 times as large as Mexico and 18 times as large as Canada in 2015).
- Is the situation with Canada really “much less severe” for the US? The data above, taken in isolation, seem to suggest so. The deficit with Mexico was about 3 times as large as it was with Canada in 2015. This seems to validate the US President’s claim.
- While this is an overly simplistic transactional perspective, it is nevertheless one that is important to the new US administration and therefore worth keeping in view.
- A closer look however shows that the gap in terms of the level of deficit with Canada vs. Mexico is much lower when the oil price is higher (as was the case in 2014).
- In fact in past years the US deficit with Canada has been much higher than with Mexico. The deficit with Canada from a US perspective was -$71 billion in 2004, -$80 billion in 2005 and -$77 billion in 2006. Whereas with Mexico it was -$47 billion in 2004, -$52 billion in 2005 and -$66 billion in 2006.
The Bottom Line
This analysis has taken a deliberately simple approach to unpacking Canada’s trade footprint on the heels of the first Trudeau Trump bilateral. Canadians were reassured that the new US President sees the trade relationship with Canada as “very outstanding” and one that is “much less severe” compared to the situation with Mexico.
Should Canadians feel reassured?
In a word: No.
Access to the US market and the importance of a stable trade relationship with the US is fundamental to Canada’s economic prospects. Any hint of uncertainty is unquestionably a big negative for Canada. Tweaking NAFTA, let alone a fundamental rethink, especially in the inconsistent and incoherent way the new US administration seems to suggest, qualifies as far more than a hint of uncertainty.
Our simple analysis fails to show why the US President felt the trade relationship with Canada was so outstanding. It is true that Canada remains the US’s largest export destination. And that the US trade deficit with Canada is lower than that with Mexico.
However Canada has already been surpassed by China as the US’s largest trade partner, and without NAFTA Canadian exports arguably could have lost competitiveness faster.
The trade situation with Canada is less severe compared to Mexico from the standpoint of US trade deficits only if one focuses on recent years and ignores earlier periods. In past years when the oil price was higher the US deficit with Canada was far higher than with Mexico.
Should Canadians feel reassured that their government is ready to play strong offence?
Again, simply, no.
During her recent visit Canada’s Foreign Affairs Minister (who, until the election of Donald Trump, was Canada’s Trade Minister) made headlines for suggesting that Canada was ready to play “strong offence” to protect its trade interests in the context of NAFTA. What this means or could mean, according to the Minister herself, is intentionally vague.
But the talking points Canadian politicians, negotiators and strategists most frequently refer to offer some clues.
The first strategy is to repeatedly reference the level of US exports to Canada from each congressional district when talking to US politicians (a data point that clearly impressed the Speaker of the House Paul Ryan). The second is to quote the 9 million US jobs that depend on trade and investment with Canada and the 35 US states for which Canada is the largest trade partner. In a new twist the Minister has suggested Canada may be ‘ready to retaliate’ in a trade war with the US, presumably with tariff and or non-tariff barriers that hurt US exports to Canada.
Unfortunately each of these arguments is easily countered and unwittingly show Canada’s limits. For instance, a quick check of product areas where Canada runs the largest deficits with the US, i.e. targets where US exports could be hurt if Canada chose to retaliate in a trade war, shows that the majority of these are heavy industrial equipment and machinery. Which means they are essential intermediate goods (as opposed to finished goods). Limitations on imports in these areas would only hurt Canada’s already low productivity (compared to the US).
Similarly, whether one focuses on the 9 million US jobs that depend on trade with Canada or the 5 million US jobs that depend on NAFTA, that represents about 3% to 5% of the US labour force. Not a small figure, but, if turned the other way – Canadian or Mexican jobs that depend on NAFTA – the ratios would be far higher.
A better approach
NAFTA is a trade agreement from pre-smartphone pre- e-commerce days. Building on it is probably overdue. A better strategy for Canada is to assume a rethink of NAFTA is coming. The way to get ahead of the same is to frame the rethinking rather than simply trying to predict and adapt to it.
A good approach is the one suggested by Carla Hill (former US trade negotiator who led the NAFTA negotiations).
First, counter the zero-sum approach the new US administration is taking on trade (especially in the context of NAFTA). To do so it is important to first of all take it seriously.
The recent Reuters/WSJ report on requests by the new US administration to use a new method to calculate US trade deficits, by excluding ‘re-exports’, which would have the effect of understating US exports and therefore widening the deficit, should be a cause for concern. Re-exports are goods that are imported and transferred with minimal value added to another country. For some countries, e.g. Hong Kong, the US and Canada, re-exports can be very significant (for Canada if they were a trade partner re-exports would be the second largest; excluding re-exports would double the size of the US trade deficit with Mexico). These moves would buy the Trump administration political leverage to make sweeping changes to trade policy.
The way to counter this zero-sum thinking is to emphasize that the majority of global trade (80%) is supply chains. This trade is dominated by intermediate, not finished goods. Second, demonstrate that the N. American and specifically Canada-US supply chains are not only the most integrated but also the most efficient in the world. As Hill suggests, ‘if you ask Washington State what it imports from Canada, the answer is aircraft parts. If you ask it what it exports, finished aircraft’. Cutting off import supply chains will hurt export competitiveness in turn.
Deeper analyses are needed in at least three areas:
- Strategic foresight: on emerging, sunrise and future high-value added sectors that current approaches and data in trade analysis cover inadequately. These can range from clean tech to alternative energy to the tech in autonomous vehicles to defense platforms to cyber-security, logistics and e-commerce. To re-frame NAFTA, better analysis is needed on the impact of NAFTA linkages on the global competitiveness of all three countries in sunrise sectors.
- Import-export competitiveness nexus: unpack just how reliant which exports are on NAFTA based import supply chains and the potential impact of disruptions on US export competitiveness (as well as Canadian and Mexican export competitiveness).
- Updated employment perspective: simply quoting the number of trade dependent jobs is not enough. The negative impact of trade agreements on employment cannot be ignored. Extending the above analysis from an employment perspective i.e. the overall diversion of employment in the context of within-group wage, productivity and labour standards arbitrage, could be valuable. Similarly, incorporating technological change, automation and their impact on the future of work – which arguably have a bigger impact than free trade on employment – into the analysis would be necessary.
Please contact data@cidpnsi.ca for more information.
Recent Comments