

Quick overview of comparative aid statistics from the OECD-DAC for 2018. Click on images below to see full page view.
DAC Country
Comparisons
(Click Image to Enlarge)
Key Year-on-Year
Changes
(Click Image to Enlarge)
Comparative ODA and
ODA/GNI levels
(Click Image to Enlarge)
About
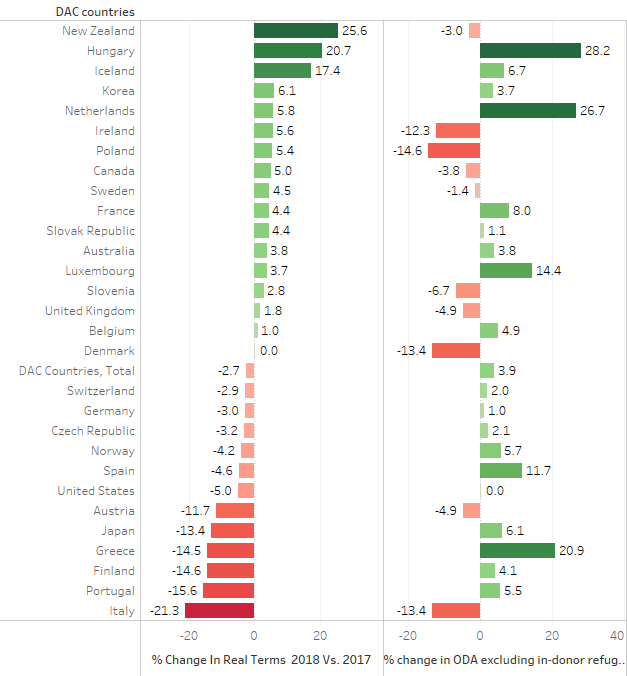
Net ODA from OECD-DAC countries reached US$ 149.3 billion in 2018, in current US$ terms. This represents 1.5% increase from the 2017 figures; a continued upward year-over-year trend from last year’s figures (an 1.1% increase). However, in real terms, net ODA from OECD-DAC countries decreased by 2.7% in 2018 from its 2017 levels.
Story behind the numbers
Factor 1: Decline in in-donor refugee costs
The decrease of net ODA (in real terms) can be attributed to the decline of in-donor refugee costs incurred by OECD-DAC donors in 2018. These costs include money spent inside donor countries for settling refugees during their first year, which according to DAC reporting rules can be reported as ‘foreign aid’ (accounting and reporting as ODA is up to donor discretion).
From 2017 to 2018, spending on in-donor refugee costs by DAC countries decreased by 24.7% (the figure was down 11.2% last year). This is compared to the 27.5% increase of in-donor refugee costs in 2015 to 2016, when in-donor refugee costs were at their highest. Excluding in-donor refugee costs, in real terms, total ODA from all members increased 3.9% compared with 2017.
Factor 2: New ODA definition, method and provisional PSI rules
2018 data reflect the first year of the DAC’s new definition of ODA going into effect. Specifically, the data reflect the change from the flat 10% discount rate and 25% grant-element definition to differential discount rates calibrated to recipient country income levels (i.e. a higher grant element requirement and higher discount rates for poorer developing countries compared to middle income countries).
2018 data also reflect reporting of certain private sector instruments (PSIs) as ODA. Rules surrounding PSIs are still provisional and the DAC is yet to achieve consensus on key areas, however provisional rules do allow for reporting of non-grant instruments such as equity, debt and capitalization of specific funds, vehicles and institutions (such as bilateral development finance institutions or DFIs). Contributions are either counted on an initial face value basis (e.g. capitalization of DFI) or cash-flow basis (e.g. loans to or equity directly in private sector entities).
The net effect of the implementation of the new reporting methodology at the moment is small. The overall net addition to ODA is 2.5% in 2018. However, impacts on individual country figures for major donors range from +40.8% for Japan, to -2.8% for France, and -3.5% for Germany.
About the data and source
For more, please visit the OECD-DAC aid statistics page. See also, the DAC’s narrative summary.
Download our clean, summary version of the data used above. (MSExcel)
Canada in the OECD-DAC (preliminary)
- Canada’s aid totaled approx. US$4.52 billion in 2018. This compares with approx. US$4.3 billion in 2017 (both in 2017 prices). Canada’s ODA increased by 5.0%, 2017 vs 2018
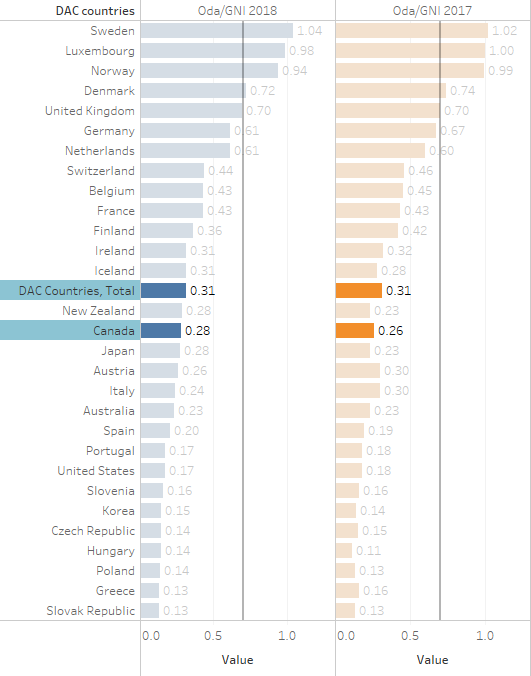
- Canada’s ODA/gross national income (GNI) ratio now stands at 0.28% — slightly higher than last year (0.26%). This ratio is below the OECD-DAC weighted average of 0.31% and the unweighted DAC country effort of 0.38%.
- Canada is the 9th largest OECD-DAC donor in volume terms. Canada’s rank has been as high as 6th in 2012.
- Using the ODA/GNI ratio Canada now ranks 15th among the 29 DAC members, up from 16th in 2017.
- In 2018, in-donor refugee costs comprised 11% of Canadian ODA.
This is a preliminary analysis of headline figures, which provide only a partial sense of Canada’s wider contribution to international development.
The story behind Canada’s numbers
Recent increases in allocations to Canada’s International Assistance Envelope (IAE), for e.g. as announced in Budget 2018, are influencing Canadian ODA.
In-donor refugee costs are a further explanatory factor. Unlike other major donors many of which have seen declines in in-donor refugee costs reported as ODA, in the case of Canada these costs now make up approx. 11% of ODA.
According to the OECD, without refugee spending, Canada’s ODA decreased by 3.8% in 2018. Without refugee costs, Canada’s ODA/GNI would have been between 0.24% and 0.25%.
2018 figures are also influenced by Canada taking advantage of new OECD-DAC provisional PSI rules. The initial contribution of CAD$100 million to the new DFI, FinDev Canada, is reported as ODA, as permissible under the new rules.
Recent Comments