By Aniket Bhushan, Lance Hadley, Elise Legault
Published: December 08, 2020
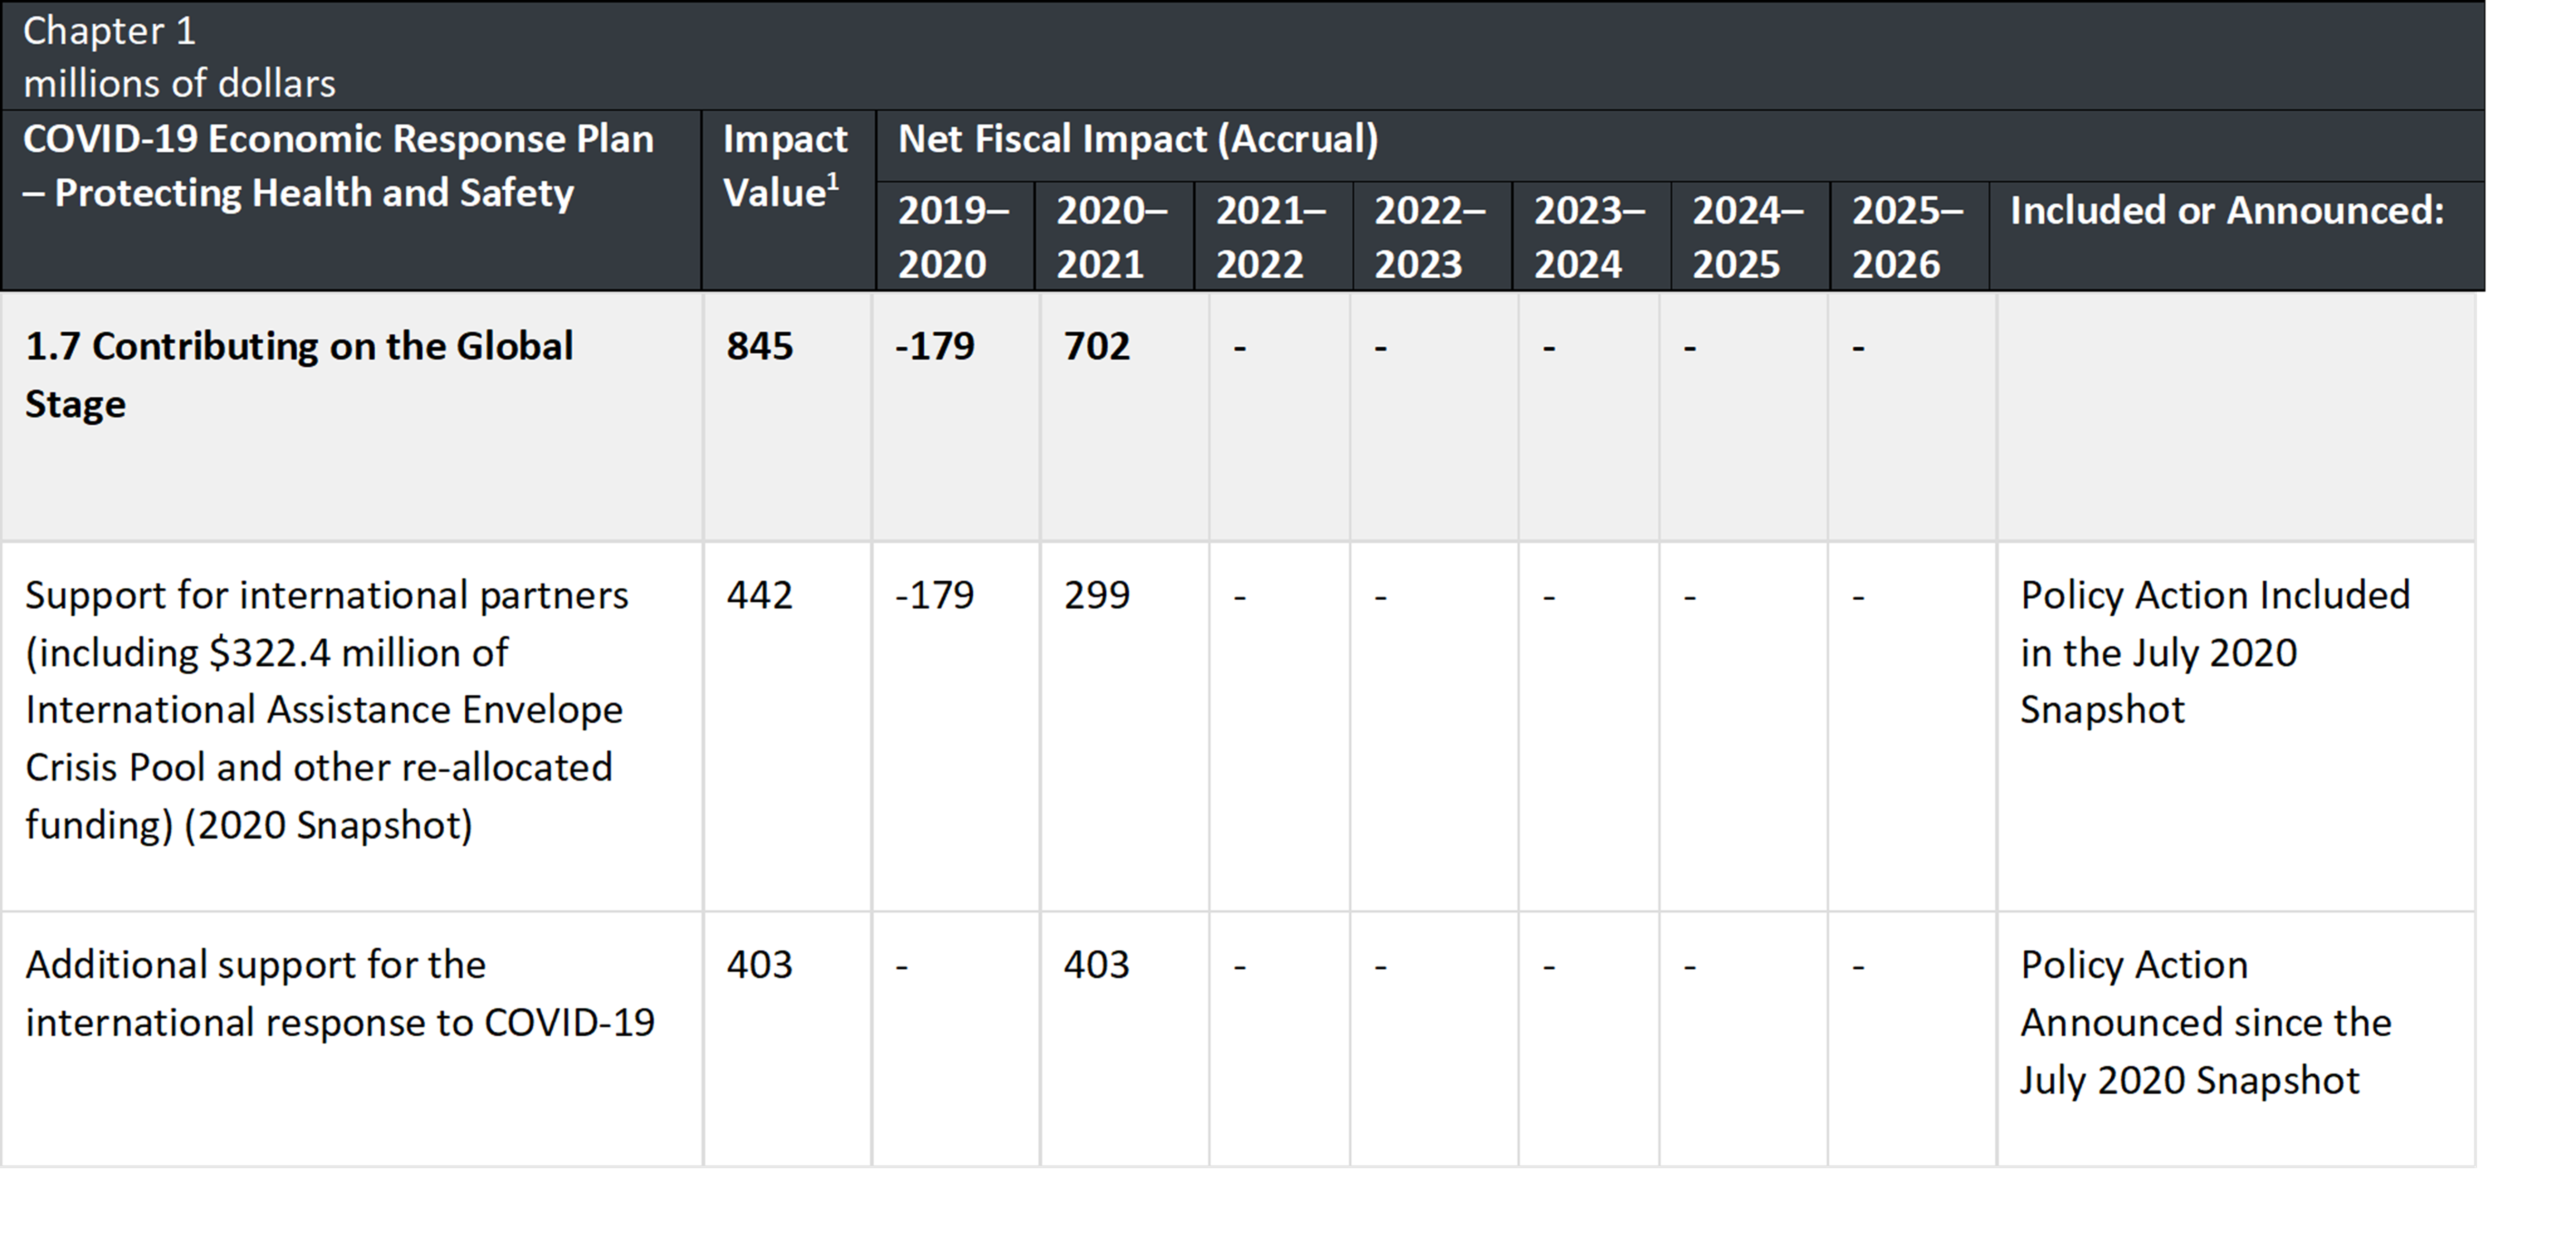
The 2020 Fall Economic Statement (FES) did not allocate any additional resources to Canada’s International Assistance Envelope (IAE), the main instrument that funds foreign aid and Canada’s contribution to global COVID response. It did quantify policy actions already announced. In line with our previous estimates, IAE additions linked to Canada’s international COVID response, including support for vaccine procurement for low income countries, stands at approx. CAD$702million in fiscal 2020-21. This represents an historic addition to the IAE in a single fiscal cycle for Canada. However, as previously discussed, this level is less than half the 1% of domestic COVID response effort called for by Canadian civil society organizations (CSOs).
The aim of this analysis is to present long-term scenarios for the IAE (out to 2030). We also provide estimates for what Canada’s official development assistance (ODA) levels and ODA/GNI ratios may look like:
- What would it take to double the IAE in 5 years and what impact would this have on the ODA/GNI ratio?
- What would it take to double the IAE in 10 years, i.e. by the SDG target date 2030, and what impact would this have on the ODA/GNI ratio?
- Accounting for 2020-21 additions, what does the IAE pathway to 2030 look like assuming no further substantial additions?
Finally, we discuss an alternative measure of fiscal effort, ODA as a share of total budgetary spending.
Main findings
Scenario A: Doubling the IAE in 5 years
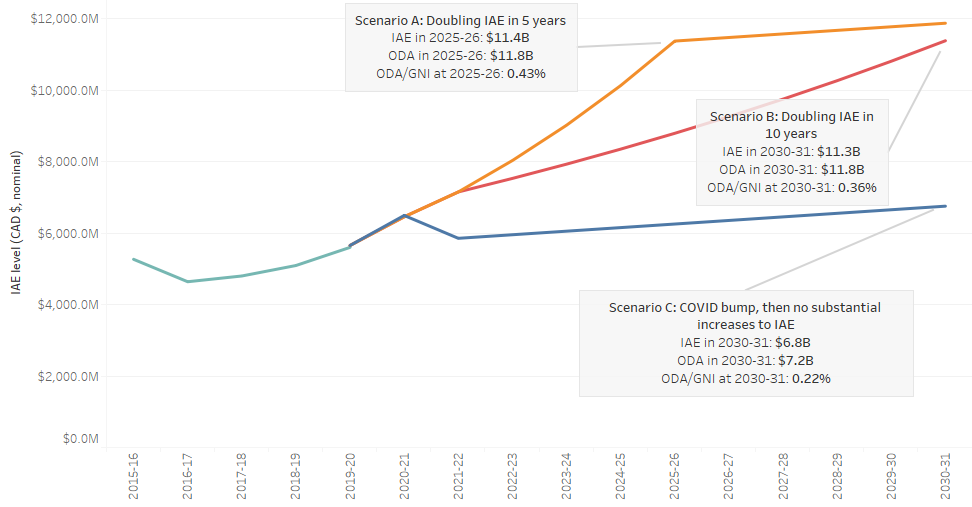
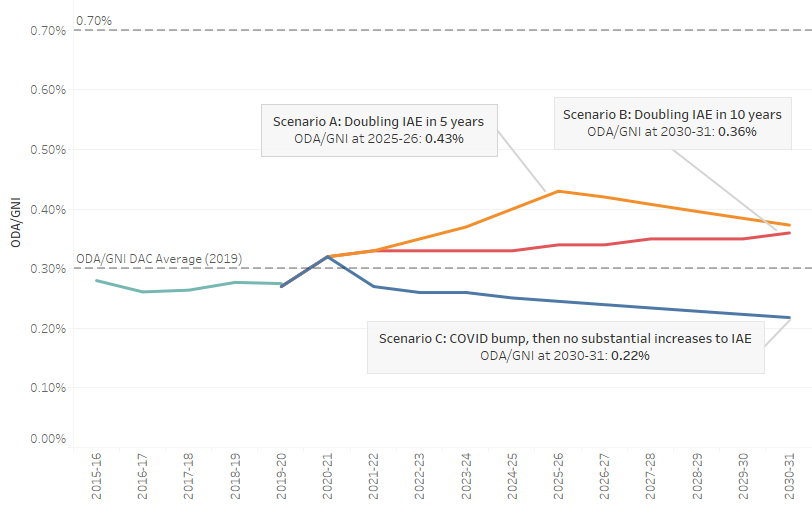
This is the most ambitious increase scenario. It would represent about twice the level of effort in terms of increasing the IAE that Canada has ever made. In this scenario the IAE doubles by 2025-26. The ODA/GNI ratio reaches 0.43%, which would represent a 3-decade high for Canada. The ratio would be substantially higher than the current near historic low of 0.27%, which makes Canada a laggard in the bottom half of the OECD DAC, well below the weighted (0.30%) and unweighted average DAC country effort (0.38%). This scenario also assumes approx. $2bn are added to the IAE over the 2020-2021 and 2021-2022 fiscal years to respond to the sector’s demand of investing 1% of Canada domestic spending on COVID on the global pandemic response, and thereafter the IAE increases by around 12% annually to double by 2025-26.
- Cost: Average Annual Dollar Growth in IAE up to 2025-2026 – $953million; thereafter, the modest current level of $100million annual increase is preserved out to 2030.
Scenario B: Doubling the IAE in 10 years
There is historical precedence for Canada doubling the IAE, with annual growth linked to a predictable (8%) anchor. Moreover, this commitment was preserved across party lines (2002-2010). If Canada were to commit to repeat this the IAE would double by 2030-31. The ODA/GNI ratio would peak at 0.36% in the same year. This scenario also assumes approx. $2bn are added to the IAE over the 2020-2021 and 2021-2022 fiscal years, and thereafter the IAE increases by around 5% annually to double by 2030-31.
- Cost: Average Annual Dollar Growth in IAE – $521million
Scenario C: COVID bump, then no substantial increase in the IAE
This scenario approximates the baseline. It is the most likely scenario if there is no significant change from the recent FES. While the FES does allocate a mystery $100billion that remains unspecified (likely to be announced by the next budget), it is unlikely that a meaningful share of this would be spent outside Canada via the IAE. This scenario assumes that the 2020-21 increase to the IAE is a one-off that is not preserved. While it causes a bump in all indicators (IAE, ODA and ODA/GNI), these revert to the pre-COVID trend immediately in 2021 and thereafter. In this scenario Canada’s ODA/GNI ratio progressively falls to a low of 0.22% by 2030.
- Cost: Average Annual Dollar Growth in IAE– no increase above the current $100million annual already allocated
How does Canada perform on our alternative measure of fiscal effort: ODA as a share of budget spending
As discussed elsewhere, an alternative measure of fiscal effort on development is ODA as a share of total budget spending. Despite some weaknesses as a comparative measure (given differences in fiscal structures across donor countries) it is a useful indicator as it relates to something governments control directly (budget spending, as opposed to overall GNI). Using this measure, Canada often performs better than peers than it does using ODA/GNI. However federal COVID spending changes the picture. Canada’s recent trend shows:
- From 2005-06 to 2012-13, when the Conservative government froze and then cut aid spending, Canada’s ODA relative to total federal budget spending ranged between 2% to 2.2%. Thereafter it fell to a low of 1.65% by 2014-15
- After the Liberal government took over in its first mandate ODA spending relative to federal budget spending increased to average approx. 1.82% just prior to the pandemic
- However, taking our 2020-21 ODA estimate of approx. $7 billion, and the FES’s total projected program spend at $621.4 billion, ODA as a share of total federal budget spending could decline to an historic low of approx. 1.12%
Scenario Comparison Summary
| Scenario A: Doubling IAE in 5 years | Scenario B: Doubling IAE in 10 years | Scenario C: COVID bump, then no substantial increases to IAE | |
| Year IAE doubles | 2025-26 | 2030-31 | – |
| Average Annual Dollar Growth in IAE (mn) (baseline = 2019-2020) | $953 | $521 | $100 |
| IAE at 2025-26 | $11,378 | $8,796 | $6,256 |
| ODA/GNI Ratio at 2025-26 | 0.43% | 0.34% | 0.25% |
| IAE at 2030-31 | $11,878 | $11,387 | $6,756 |
| ODA/GNI Ratio at 2030-31 | 0.37% | 0.36% | 0.22% |
Projected paths for Canada’s IAE in the three scenarios
Projected paths for Canada’s ODA/GNI ratio in the three scenarios


Recent Comments