
This dashboard provides data on Canadian foreign direct investment (FDI) abroad.
Canadian Foreign Direct Investment Abroad
Foreign investment by Canadian corporations forms a key part of Canada’s global engagement. In a globalized world FDI is a key driver of financing for development. Using this dashboard, you can access trends over time in the stock of Canadian FDI abroad.
The total stock of Canadian FDI abroad reached $1.25 trillion in 2018. The corresponding figure for 2017 was about $1.10 trillion in 2017. Canada’s net FDI position, or the difference between Canadian FDI abroad and FDI in Canada, stands at about $380 billion, which implies that Canadian corporations have invested more overseas than foreign corporations have invested in Canada.
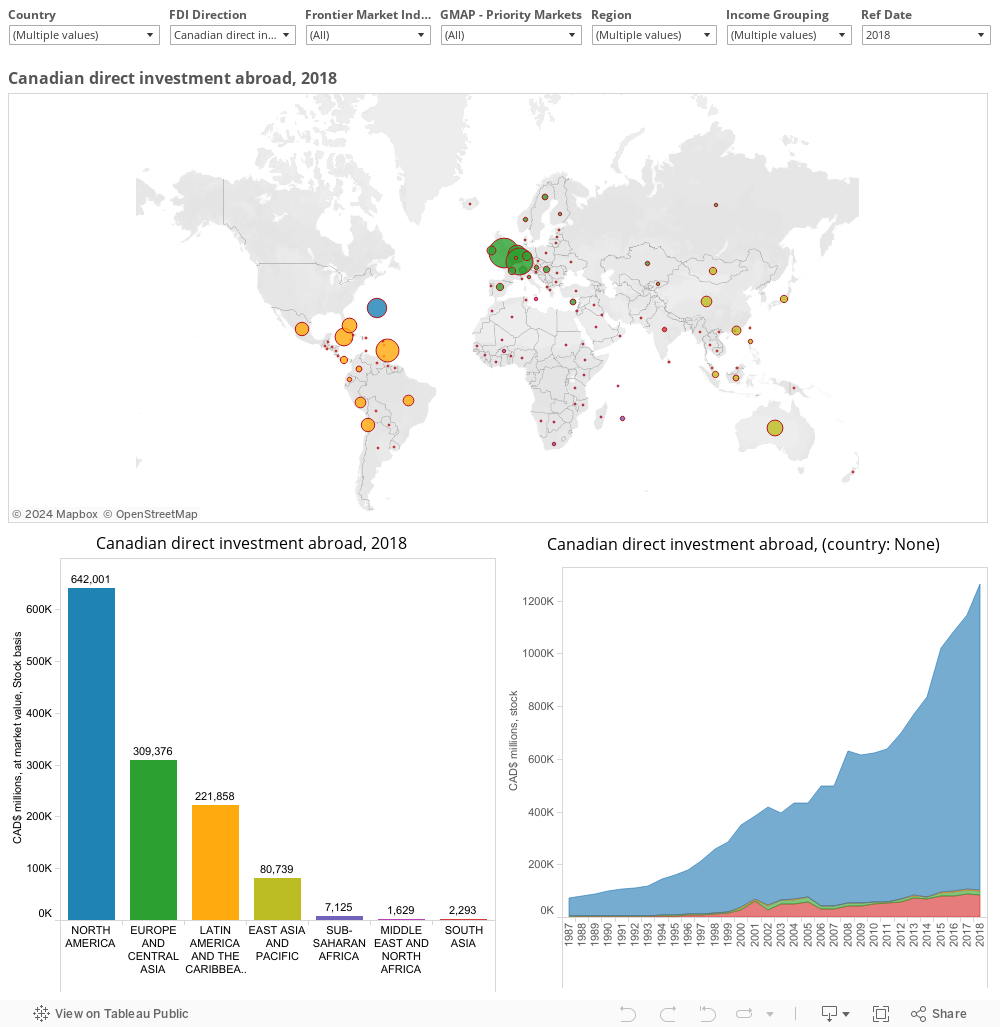
While declining, the US still accounts for by far the largest share of Canadian FDI abroad. In fact, the US is so large (47% of Canadian FDI overseas in 2018) that we remove it from the map above in order to show other countries more clearly.
Hover over country circles in the map to see the total stock of Canadian FDI in that country. Click on the circle to see the trend over time (bar graph below). Select “control” to select multiple countries to compare. In addition to the map the data is also aggregated by region and income group. In each case line graphs represent the trend of the total stock of FDI over time, as actual value and as percentage of total Canadian FDI abroad. All graphs and maps are linked, such that selecting the line graph, say for upper middle-income countries or Latin American countries, will highlight the group selected on the map. Three drop-down menus are provided at the top. The map and data can be directly limited using these, by region, income group, and the year shown can be changed in the map.
What the data shows
Canadian FDI abroad is highly concentrated, both in terms of regions and income groups. The majority of Canadian FDI abroad remains within North America with the US accounting for the largest share, as mentioned above. In percentage terms, 51% remains in North America, 25% goes to countries in Europe and Central Asia, 17% to countries in Latin America and 7% to countries in East Asia.
Over time, the geography of Canadian FDI has shifted with Latin America experiencing the largest proportional increase of Canada’s FDI from 2001 to 2018; North America suffered the largest proportional decline. After the US, the largest destinations for Canadian FDI abroad are UK, Luxembourg, Barbados, and Bermuda. In 2017, these five countries together accounted for over 70% of Canadian FDI. Similarly, Canadian FDI overseas is also highly concentrated in terms of income groups with 90% going to high income countries.
The total stock of Canadian FDI in developing countries has increased marginally between 2001 and 2018 from $69.2 billion to $92.6 billion. representing a compound annual growth rate (CAGR) of 1.73%. However, the rate of growth of overall Canadian FDI over this same period was 7.2%; demonstrating the tendency for Canadian companies to invest in developed markets. Canadian FDI in developing countries only accounted for around 7.3% of total Canadian FDI in 2018.
An interesting finding from the data is how rapidly Canada’s net investment position (FDI only) is changing with major emerging economies. As recently as 2000, Canadian FDI in Brazil, China, and India far exceeded FDI from these countries in Canada. Current FDI stocks from Brazil, China, and India in Canada has far surpassed Canadian FDI in these countries, even though Canadian FDI has grown rapidly. By 2018, Brazilian investment in Canada stood at $14.6 billion and Canadian investment in Brazil was around $14.1 billion, Ch Chinese investment in Canada was valued at $16.9 billion while Canadian investment in China was only around $12.7 billion, and Indian investment in Canada was worth $2.5 billion while Canadian investment in India was $2.2 billion. This pattern indicates that Canada is now a more significant investment destination for these countries than they are for Canada.
About the data and data issues
FDI data are drawn from Statistics Canada’s CANSIM database. Specifically, table 36-10-0008-01 (formerly CANSIM 376-0051) is used because it provides disaggregated information on the stock of Canadian FDI. There are two issues with these data. First, it is only available (at this disaggregated level) on stock basis. Stock means the total amount of FDI in that particular country for all years up to that year, as opposed to flows which are in a given year.
The second issue is that FDI data are subject to confidentiality considerations. For instance, when one or two firms account for the entire stock of Canadian FDI in a partner country, these data are kept confidential. For example, in 2011 data were kept confidential for 84 out of 153 countries. However, this does not affect regional or other aggregates and the total values shown here reflect actual totals.
We applied the World Bank’s regional and income classification system to the Canadian data to enable comparisons. The data is in current Canadian dollars. A “stacked version” (on year) can be freely downloaded below in MSExcel format.
We also came across discrepancies in FDI data found in official databases (such as CANSIM) and reported in official publications, specifically the Department of Foreign Affair’s annual trade and investment update (Department of Foreign Affairs and International Trade Canada. 2012. Canada’s State of Trade: Trade and Investment Update 2012. Ottawa: Public Works and Government Services Canada). Past data tends to be subject to revision, this may explain some of the differences, but in general a lot more effort is needed and can be made to make FDI data, especially on flow basis, more readily available for analysis.
CDN FDI Abroad (2019 web update) (MS Excel)
Contact
This data is part of ongoing research at the Canadian International Development Platform. For more information or to comment please use the contact page. Or find us on Twitter: @CIDPNSI
Recent Comments