
The dashboard below provides data and analysis on Canada’s international assistance.
International Assistance Spending
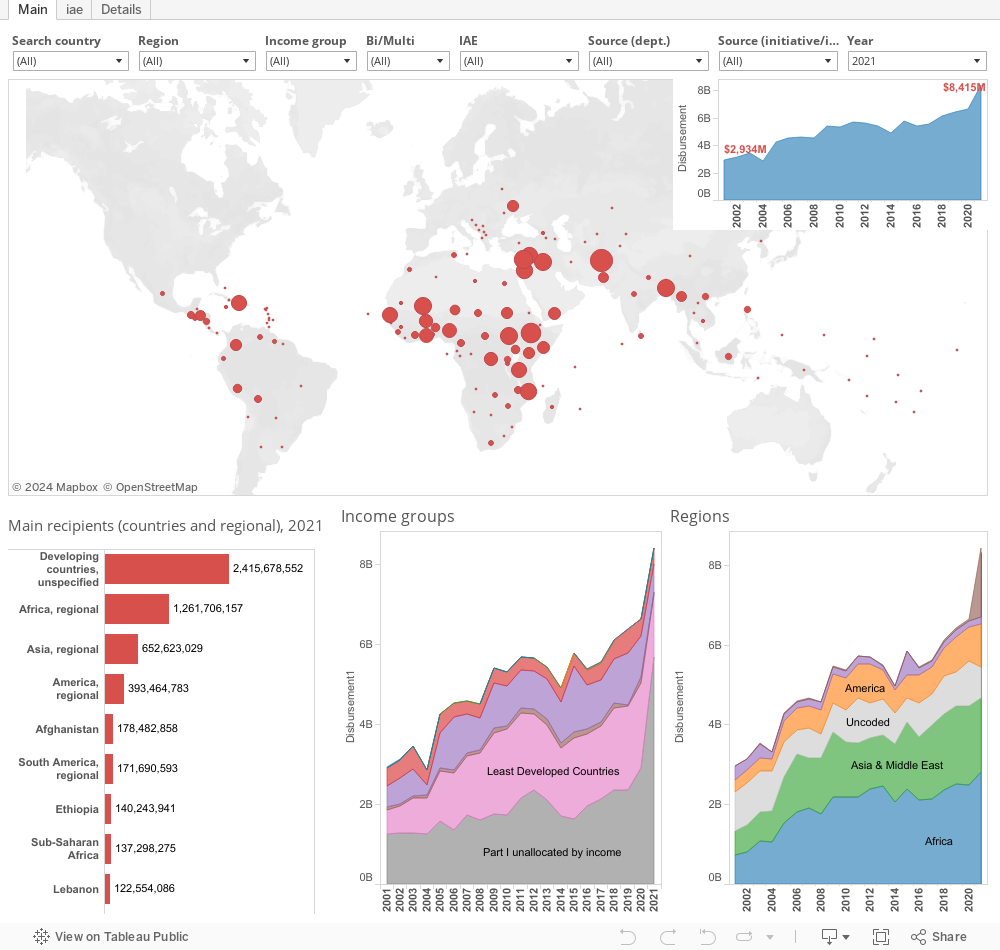
Canada’s international assistance spending increased by 27.0% to CAD$8.4 billion in 2021, up from CAD$6.6 billion in 2020.
International assistance accounts for approx. 1.6% of 2021 federal budget spending – significantly up from last years 1.0% budget expenditure in 2020. This rise, however, is largely explained by the dramatic drop in budget expenditures compared to the previous year.
In 2021, Canada’s ODA/gross national income (GNI) ratio stood at 0.31% — up from 2020 (0.27%).
Who are the largest recipients?
The largest recipient in 2021 was Afghanistan (CAD$178 million), followed by Ethiopia (CAD$140 million), Lebanon (CAD$123million), South Sudan (CAD$115 million), and Mali (CAD$109 million).
Where were the sharpest increases and declines?
The most notable changes in year-over-year international assistance levels were to: Lebanon(+39%), DRC(-55%), Kenya(-57%), Bangladesh (-36%), and Nigeria (-42%). Lebanon received the largest year-over-year dollar increase; up CAD$34.3 million from last year.
Income Groups and Regions
18.7% of aid went to Least Developed (or poorest) Countries, another 0.8% went to Other Low Income Countries, and 8.3% went to Lower Middle Income countries (67.6% is not coded by income group).
African countries received the largest regional share of Canada’s international assistance at 33.3%, followed by Asia & Middle East(22.0%), the Americas (12.9%), Europe (1.9%), and Oceania (1.1%). This is only international assistance that has been coded to a region (90.1% of total).
Departmental and Government channels
The amalgamation of the former aid agency CIDA into foreign affairs, and re-branding as Global Affairs Canada (GAC), continues to complicate the departmental sources and channels picture. Typically about 65% to 75% of aid was channeled through (former) CIDA.
Most of this has now transitioned to GAC consolidated. Which means it is not possible to easily distinguish (former) CIDA from (former) DFAIT assistance.
The more relevant distinction is whether the financing is from the international assistance envelope (IAE) or non-IAE. The IAE accounts for the vast majority, 91%, or CAD$7.7 billion in 2021. Non-IAE channels are 9% (or CAD$0.8 billion) and comprise items such as the cost of settling refugees.
The three major IAE channels are GAC (90.9%), Finance (6.7%), and IDRC (2.0%).
Using the Data
Hover over country circles on the map to see how much went to which countries. Circles are sized to reflect the amount of Canadian aid the country receives (in the selected year, by default most recent).
Clicking on a country will reveal links that can be clicked for more details. Doing so will switch the view to the details table, where further selections can be made.
Use drop-downs to limit the data by “region”, “income level” or change “year”; by “bilateral vs. multilateral”, “departmental sources, or specific initiatives (where relevant)”.
Multiple countries can be selected at one time for comparison (no more than two at a time are recommended). Hold down Control + right click. Click again to deselect. Refresh browser or click “Reset” at the bottom of the dashboard to reset the view. At any point, to go back, click “Undo” at the bottom of the dashboard.
Methodology
Data is sourced from CIDA Statistical Report on International Assistance for reporting years prior to 2017 and the Historical Projects Data Set for reporting years including and after 2017. After 2017, international assistance spending was included in the Historical Projects Data Set, but not applied retroactively to other HPDS years. We have merged these datasets, where possible, to give a coherent time series for the reporting above. The MS Excel version of this data can be downloaded below.
OECD-DAC country, regional and income classification coding is also applied.
Data is reported on “gross” basis (i.e. loan repayments, which entail negative transactions, are excluded). In order to simplify interpretation calendar years are used, but the data is on a fiscal year basis (i.e. 2001 is 2000-01 and so on).
There may be slight differences between this data and data from the OECD-DAC. This is for two reasons: fiscal year (as opposed to calendar year) is used here, and Canadian dollar (as opposed to US dollar) is the currency unit.
Note: this data was last updated in March 2021. Data can be freely extracted from the above dashboard using the “download” options.
Updated raw data are provided below, in detail, by country/region/income group/source/channel, on gross basis, in CAD$, on fiscal year basis.
Aid (2020) web-version (MS Excel)
Contact
This data is part of ongoing research at the Canadian International Development Platform. For more information please contact: aniket.bhusan@carleton.ca
[…] coal consumption by $4.92 billion — incidentally about the same amount as Canada provided in foreign aid in 2014. I’m not even going to bother to crunch the numbers. This climate-killing 19th […]
[…] development strategies, even the really good ones, are flawed no matter what. In 2014, Canada gave $108 million in international aid to Bangladesh. How lovely of us, right? In the same year, Canada imported $1.2 million of apparel products from […]
Is this available in French?
Not at this time. But we hope so in the near future.
– CIDP
[…] but help strengthen the AIIB’s implicit loan guarantee. For perspective, Canada provided roughly $5.8 billion in direct international development assistance last year. That puts the $8-10 million in costs to […]
[…] poor nations recovering from major storms) depend enormously on foreign aid. We still offer less foreign aid than our allies, at 0.28% of our GDP compared to 0.7% from Great Britain. Our generosity has been […]