
Use this dashboard to compare portfolio investment assets overseas.
About
International portfolio investments represent a significant component of the globalized economy. For Canada, the asset position of international portfolio investments represented $1.2 trillion at June 2015. The countries with the largest holdings of Canadian portfolio investment assets were the United States ($731 bil), the United Kingdom ($90 bil), and Japan ($58 bil) at June 2015.
Similarly, as a destination for portfolio investments, Canada holds $1.3 trillion of investment assets. The top three holders at June 2015 were the United States ($850 bil), Luxembourg ($62 bil), and Japan ($58 bil).
How to use the data
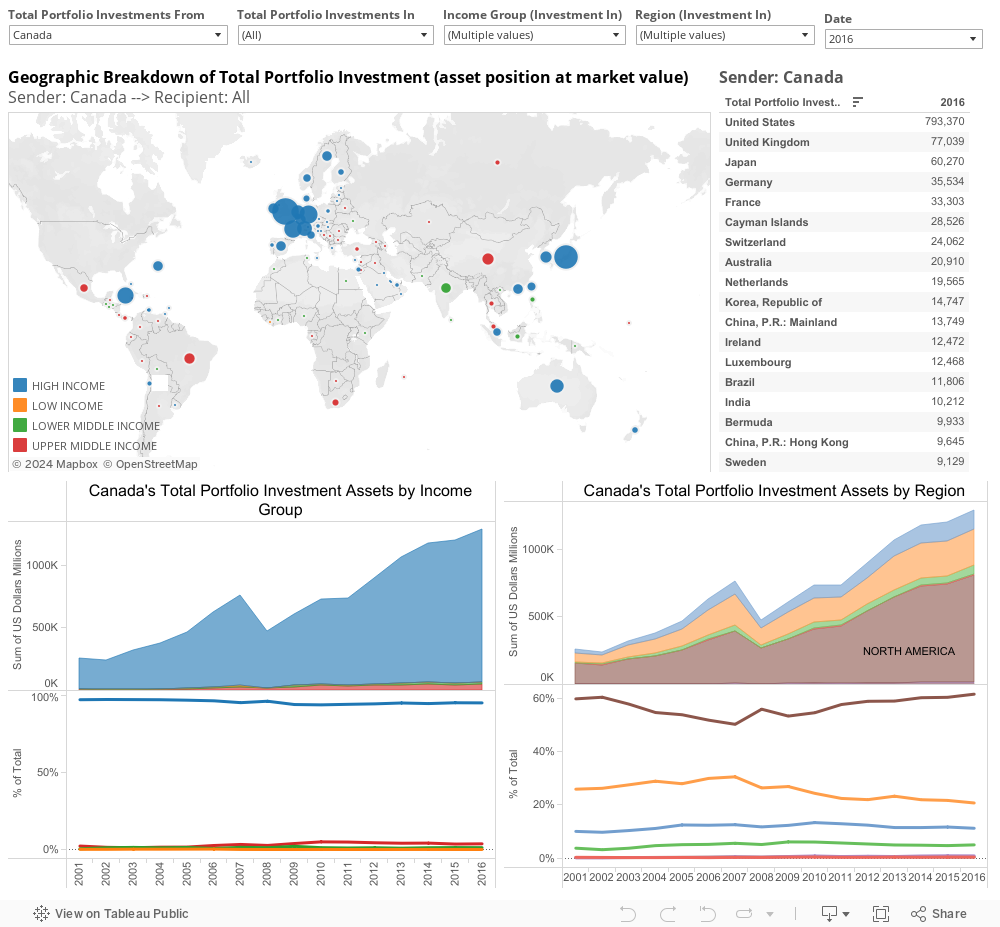
Hover over country circles on the map to see the total value of foreign securities held by the sender country (Canada is the default sender country). Circles are sized to the total asset position position at market value held by a country at the selected date (June 2015).
To change the sender country, select a country from the ‘Total Portfolio Investments From’ dropdown. Additionally, use drop-downs to limit the data by ‘Total Portfolio Investments In’, ‘Income Group (Investment In),’ ‘Region (Investment In),’ or change the ‘Date.’
The bottom left pane represents the distribution of the sender country foreign securities across income groups and the bottom right pane represents the distribution by region. Each of these panes are horizontally divided between the sum of investments and the percentage.
Clicking a country on the map will replace the bottom right pane with a country-specific time-series analysis of the foreign security investments in the selected country from the sender country. Multiple countries can be selected at one time for comparison (no more than two at a time are recommended). Hold down Control + right click. Click again to deselect.
What the data show
High income countries account for 95% of the total at $1.15 trillion Canadian portfolio assets (at market) overseas in June 2015. The United States, at $731 billion, alone accounts for 61% of all portfolio assets. Of the 5% of total Canadian foreign investment among developing regions, China ($27 bil), Brazil ($10 bil), and India ($8.5 bil) are the primary holders of Canadian foreign investments.
Additionally, in these developing countries, Canada is the 6th largest investor in China, 8th in Brazil, and 9th in India.
About the data sources
Data is drawn from Coordination Portfolio Investment Survey (CPIS). The World Bank’s geographical and income classification system is used. For comparison with aid flows countries were also classified using the OECD-DAC system.
Recent Comments