
Quick overview of comparative aid statistics from the OECD-DAC for 2017. Click on images below to see full page view.
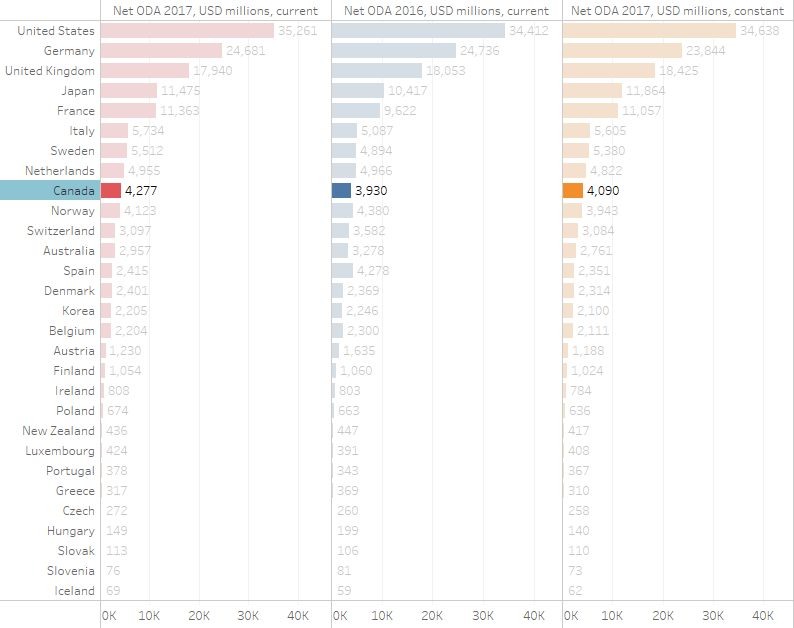
DAC Country
Comparisons
(Click Image to Enlarge)
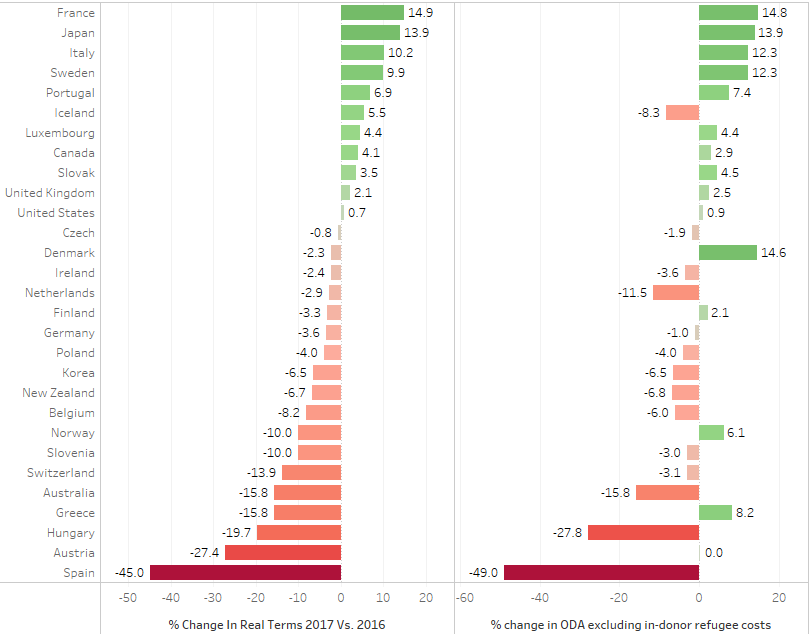
Key Year-on-Year
Changes
(Click Image to Enlarge)
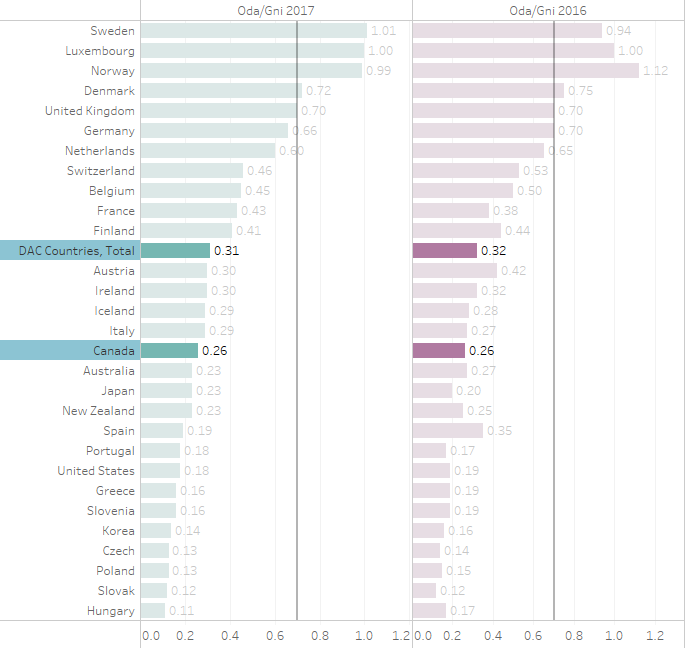
Comparative ODA and
ODA/GNI levels
(Click Image to Enlarge)
About
Net ODA from OECD-DAC countries reached US$ 146.6 billion in 2017, in current US$ terms. This represents 1.1% increase from the 2016 figures; a significantly smaller year-over-year increase than last year’s figures (an 8.9% increase). However, in real terms, net ODA from OECD-DAC countries decreased by 0.6% in 2017 from its 2016 levels.
Story behind the numbers
The decrease, in real terms, of net ODA can be attributed to the lower levels of in-donor refugee costs incurred by the OECD-DAC donors in 2017. These costs include money spent inside donor countries for settling refugees, but according to DAC reporting rules can be reported as ‘foreign aid’ (to a large extent the accounting is up to donor discretion).
From 2016 to 2017, spending on in-donor refugee costs by DAC countries decreased by 11.2%. This decrease is surprising given the 27.5% increase in the 2015 to 2016 year-over-year comparison. These costs now account for 9.7% of net ODA, down from 11% one year ago. Italy and Germany led all other major donors by having 31.4% and 24.6% of their respective net ODA figures accounted for by refugee costs. The United Kingdom is the lowest with 2.7%.
About the data and source
For more, please visit the OECD-DAC aid statistics page. See also, the DAC’s narrative summary.
Download our clean, summary version of the data used above. (MSExcel)
Canada in the OECD-DAC (preliminary)
The main objective of this quick preliminary analysis is to reflect on the data from the perspective of where Canada stands relative to OECD-DAC donors.
- Canada’s aid totalled approx. US$4.09 billion in 2017, if viewed in 2016 prices and exchange rates.
- This compares with approx. US$3.93 billion in 2016
- Canada’s ODA, in real terms, increased by 4.1%, 2016 vs 2017
- Canada’s ODA/gross national income (GNI) ratio now stands at 0.26% — the same as it was in 2016.
- This puts Canada’s ODA/GNI ratio below the OECD-DAC average of approx. 0.31%.
- In net ODA volume terms, Canada now ranks as the 9th largest OECD-DAC donor – Canada’s rank has moved up two places since 2016.
- By comparison, in 2012 Canada ranked the 6th largest OECD-DAC donor, in 2013 Canada ranked 9th, in 2014 Canada’s rank was 10th, and in 2015 Canada’s rank rose back to 9th.
- Based on the ODA/GNI ratio Canada now ranks 16th among the 29 DAC members, down from 15th in 2016.
- In 2017, refugee costs composed almost 11% of Canadian ODA.
This is a preliminary analysis of headline figures, which provide only a partial sense of Canada’s wider contribution to international development.
The story behind Canada’s numbers
In 2017, refugee costs continued to increase, growing from 9.9% of net total ODA in 2016 to 10.9% of net ODA. This is one year after Canada’s share of in-donor refugee costs to net ODA almost doubled from 5% in 2015 to 9.9% in 2016.
The OECD reports that without refugee spending, Canada’s ODA increased by 2.9% in 2017; up from a 9.3% year-over-year decrease in 2016. Without refugee costs, Canada’s ODA/GNI would have been between 0.23% and 0.24%.
Recent Comments