by Rachael Calleja
Published: October 24, 2017
Canada’s Feminist International Assistance Policy (FIAP) does away with the “countries of focus” lists of the past. By way of guidance on how much of Canada’s assistance is to be allocated where, geographically speaking, one of the key commitments is to ensure that “no less than 50% of bilateral ODA is allocated to countries in sub-Saharan Africa (SSA) by 2021-22”.
We examine trends in foreign aid to SSA to explore what this target entails. Does this target make sense given what we know about trends in the geography of global poverty?
How much bilateral ODA is currently allocated to sub-Saharan Africa?
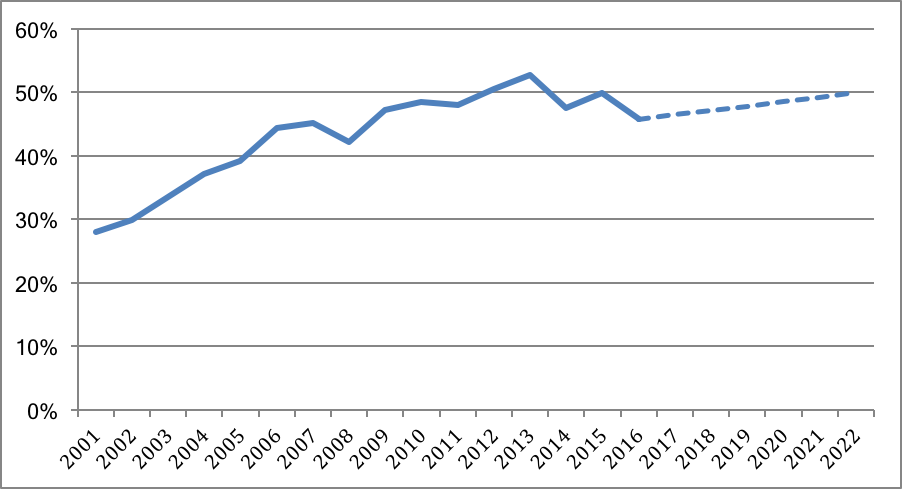
In 2016, 45.8% of Canada’s bilateral ODA was allocated to countries in sub-Saharan Africa. The largest recipients in the region were Ethiopia, Ghana, Tanzania, Mali, and Nigeria, each of which was on Canada’s now-discontinued list of countries of focus and partner countries.
Overall, Canada has increased its focus on SSA since the early 2000s. SSA’s share of Canadian ODA increased from under 30% in 2001 to a peak of 52.7% in 2013, i.e. already surpassing the ‘new’ FIAP target of 50%.
Figure 1: % Canadian ODA to SSA, actual and projections1

Does this target make sense given what we know about the changing geography of poverty?
Globally, extreme poverty (at $1.90/ day) has decreased rapidly over the last two decades (from 35% in 1990 to a predicted 9.6% in 2015). As a share of regional population, extreme poverty has declined in all developing regions, including SSA (from 54.3% in 1990 to 41% in 2013).
However, SSA is the only region where the absolute number of extreme poor has increased. This is because the rate of population growth has been faster than the rate of poverty reduction. As a result, in SSA, the number of people living in extreme poverty has increased (from 371.3 million in 1999 to 388.7 million in 2013).
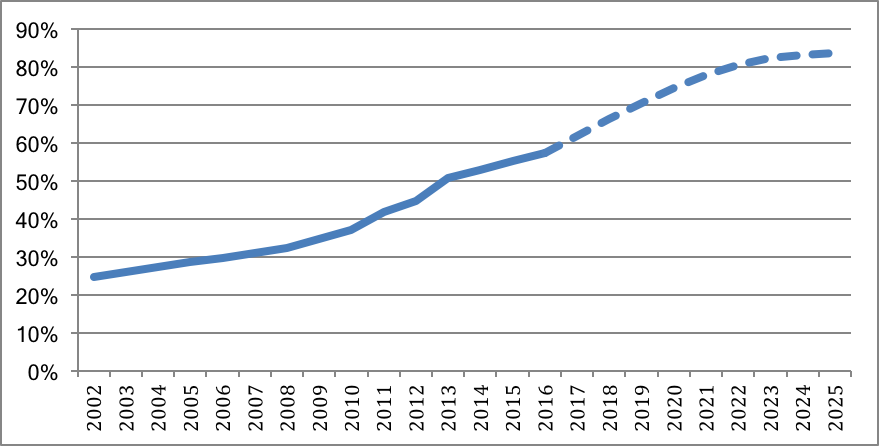
Global poverty is, and will continue to be, increasingly concentrated in SSA. In 2016, SSA accounted for approximately 57% of global extreme poverty, up from 31% a decade earlier. By 2025, extreme poverty in SSA is predicted to account for more than 80% of extreme poverty worldwide.
Figure 2: Extreme headcount poverty in SSA as % of global headcount poverty (actual and projections)

Source: World Bank Povcalnet data (2002-2015)2 and World Poverty Clock (2016-2025)3
Benchmarking the status quo?
Given the above context, is the target meaningful, let alone ambitious? Not really.
The Government of Canada’s desire to focus its international assistance on SSA is clearly well aligned with needs. However, Canada’s bilateral aid has already trended towards SSA over the last 15 years (recall the Martin Government’s 2005 commitment to double aid to Africa, for instance).
This makes sense because Canada’s bilateral assistance has become more focused on need—as proxied by poverty levels—than say, geo-strategic interests (where the two are inconsistent). Bilateral ODA to low-income countries (LDCs and Other LICs using the World Bank’s classification) rose from 39% in 2001 to around 55% in 2016 (excluding ODA not coded by income group).
With only modest growth in bilateral allocation to SSA needed to reach and maintain the 50% level by 2021-22, the FIAP target gives the impression of benchmarking the status quo. It neither reflects long-term thinking nor a desire for greater focus.
This makes the framework ambiguous, especially in the absence of the erstwhile countries of focus list (which, for all its problems, at least provided a benchmark against which performance could be reflected). It is even more unambitious in the context of an overall aid budget that is not growing.
Reaching the 50% target in the Government’s time-frame will require an annual increase in ODA to SSA of a mere 1.48% over the next five years. This would put bilateral allocation to SSA (geographic, global issues and development and partnerships for development innovation) at around CAD$1.23 billion by 2021-22, up from around CAD$1.13 billion in 2016.
Striving for the status quo is concerning when we know that the global poverty landscape is predicted to change rapidly. It is also inadequate given trends in ODA to the region more broadly.
While Canada is currently Africa’s 6th largest DAC donor according to the OECD, when we include non-DAC, multilateral and other aid providers, Canada does not rank among the top 10. At USD$1.08 billion (2015), Canadian ODA to the region barely makes up 2.1% of the total USD$51 billion in net ODA that Africa receives annually (2015) (the figure is approx. 4% for sub-Saharan Africa).
From a Canadian vantage point, the focus on SSA has increased. However, the combined effect of a depreciating Canadian dollar and a flat overall budget means that, in absolute USD$ terms, Canada’s aid to Africa and rank as a donor has declined.
New aid providers like China are already playing a significant role in the region. Based on the Aid Data project, we estimate that China’s total ODA-like investment in Africa was approx. USD$5.4 billion in 2014—four to five times more than Canadian international assistance. If Canada is to remain an effective partner in the region, the new FIAP must be backed up by a larger absolute amount focused on the region.
1 Calculations include bilateral resources allocated through “Geographic programs”, “Global Issues and Development” and “Partnerships for Development Innovation” as per the GAC/CIDA Statistical Report on International Assistance. We do not include aid from the “Other” vertical as this spending is mostly administrative and can be safely removed. These calculations are based on current accounting practices and therefore may provide imperfect representations of past trends. However, in the absence of easily comparable data over time, this serves as the best approximation. Total bilateral assistance includes unallocable by region.
2 Povcalnet data is patchy at best. To smooth the series, we interpolated missing observations for the years 2003-04, 2006-07, 2009 and 2014-15 using the cumulative annual growth rate.
3 World Poverty Clock reports the number of people living in poverty per region. Seeing as sub-Saharan Africa is not considered to be a separate region, we used the predicted poverty levels for Africa and subtracted predicted rates for two North African countries with high predicted future poverty (Yemen and Libya). All other North African countries are predicted to have poverty rates below 3% of the population. However, the number of people predicted to be impoverished in each country below 3% is not given by the World Poverty Clock. As a result, the calculation includes North African countries with low predicted poverty. Due to the low level, it is unlikely that these countries will drastically affect results.


Recent Comments