
by Fraser Reilly-King and Aniket Bhushan
Published: October 18, 2016
Spending 0.7% of gross national income (GNI) on official development assistance (ODA), or aid, is a long-standing target among OECD-DAC donor countries. Six (6) out of 28 OECD-DAC donors achieved this target in 2015. Among major donors this includes most recently the UK. They achieved the target in 2014 thanks in part to a long-term plan and steadfast commitment to development spending, including through a period of significant domestic fiscal pressure and global economic uncertainty.
Canada spends roughly 0.26% of GNI on ODA at the moment.
How does Canada get to 0.7?
The aim of this piece is to animate discussion about what it would take for Canada to achieve 0.7% of ODA/GNI. To do so we have developed three scenarios for Canada. These are visualized and discussed below.
Scenario A: Ambitious growth until 0.7, then taper but maintain the level
This is the most ambitious of our three scenarios. In Scenario A “ambitious growth, then taper”, Canada’s international assistance envelope (IAE), which forms the base of most of Canada’s ODA spending, would increase at an annualized nominal rate of 16% per year from 2017-18 to 2025-26. The rate of growth could then taper off (to 10% increase in 2026-27 and 4% increases thereafter).
In Scenario A, 0.7% of ODA/GNI would be achieved by 2026-27, and maintained thereafter.
The estimated additional fiscal cost of this scenario over the next 3 years would be approx. CAD$2.6 billion.
Scenario B: the “UK experience”
Our Scenario B can be characterized as the “UK experience”. The UK’s starting point when it made the commitment to reach 0.7 is very similar to where Canada is today. In this scenario we apply the same path to project Canada’s future ratios. In this scenario the IAE would increase at an annualized nominal rate of 12% per year from 2017-18 to 2030-31 (i.e. the target date for the Sustainable Development Goals or SDGs).
In Scenario B, 0.7% of ODA/GNI would be achieved by 2030-31.
The estimated additional fiscal cost of this scenario over the next 3 years would be approx. CAD$1.9 billion.
Scenario C: Canadian precedence
Scenario C is the least ambitious of our three scenarios, but, it can be characterized as building on “Canadian precedence” – it is something Canada has committed to and achieved in the past. In 2002 Canada made a commitment to “double the IAE” by 2010, and did so. In this scenario the IAE would increase at an annualized nominal rate of 8% per year, at least until the envelope is doubled, which would take around nine years.
In Scenario C, 0.7% of ODA/GNI is not achieved within the SDG timeframe, and Canada’s ODA/GNI ratio peaks at a high of 0.43% in 2030-31. At this rate of growth it would take till 2044-45 for Canada to reach 0.7.
The estimated additional fiscal cost of this scenario over the next 3 years would be approx. CAD$1.2 billion.
Comparison and Summary
The three scenarios we have developed here are based on a very simple (linear) approach to projection, and using simple assumptions about long-term nominal growth for the Canadian economy (which we assume to be between 3% and 4%). In addition they do not account for changes in the definition and valuation of what counts, how, and how much, as “ODA”, which we know is not a constant. These caveats aside, our scenarios provide basis for further discussion about the level of effort needed for Canada to elevate its position to be among the top performers on this measure in the OECD-DAC.
The following tables provide a summary of key milestones, the projected paths for Canada’s IAE, and Canada’s ODA/GNI ratio under the three different scenarios.
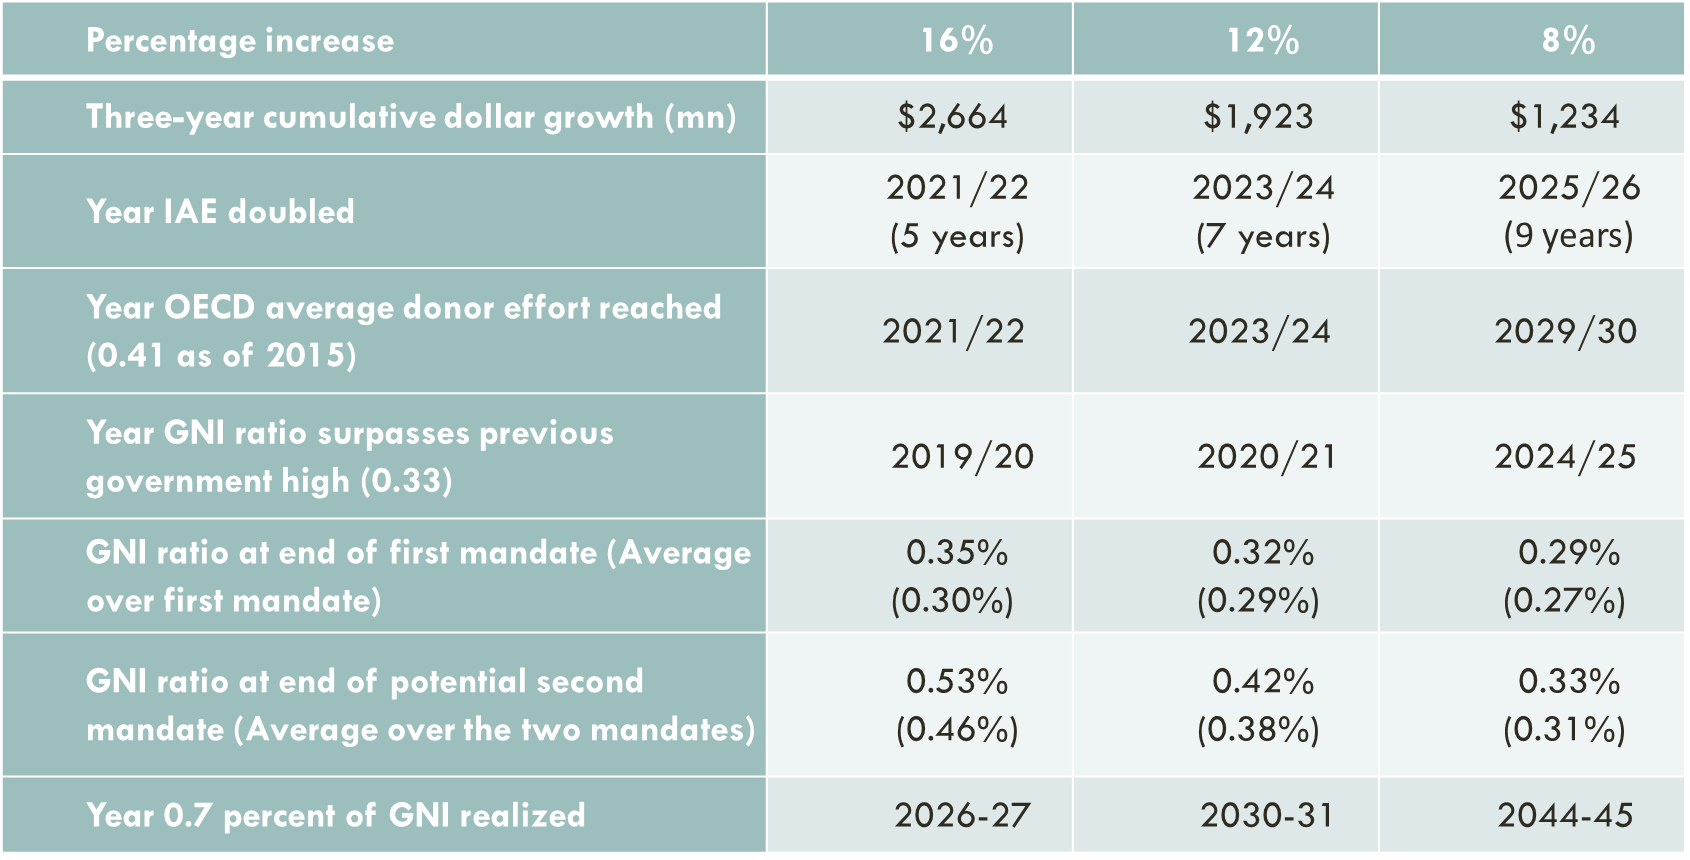
Figure 1. Comparative table of key milestones
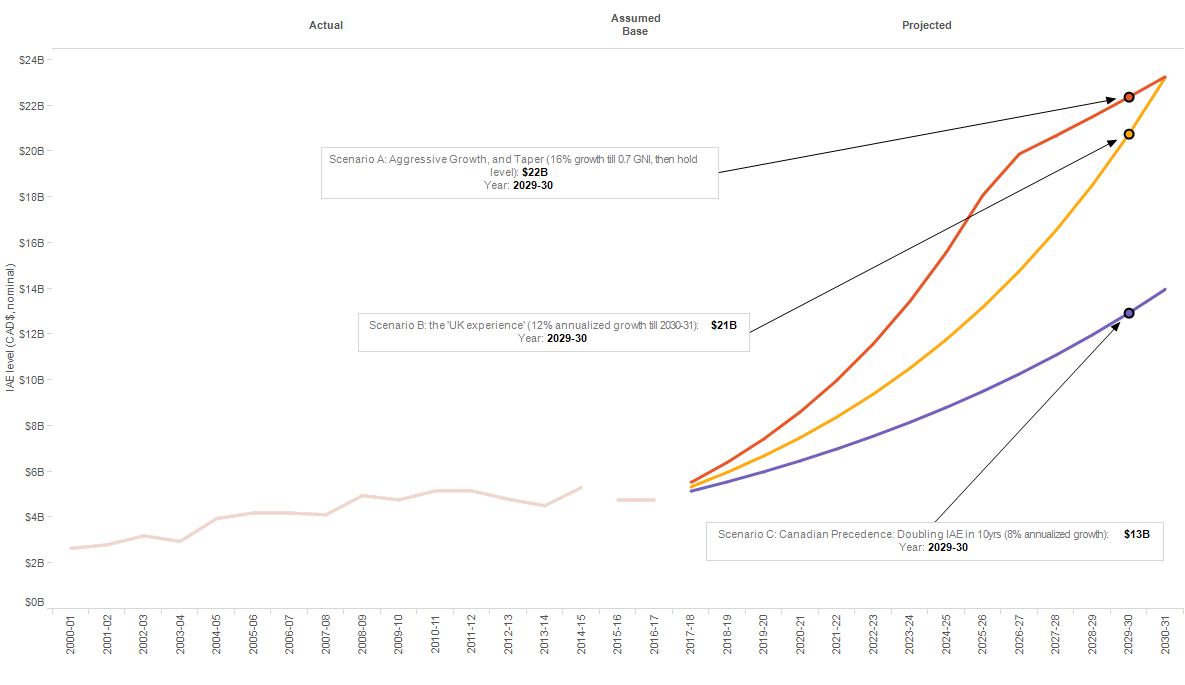
Figure 2. Projected paths for Canada’s IAE in the three scenarios
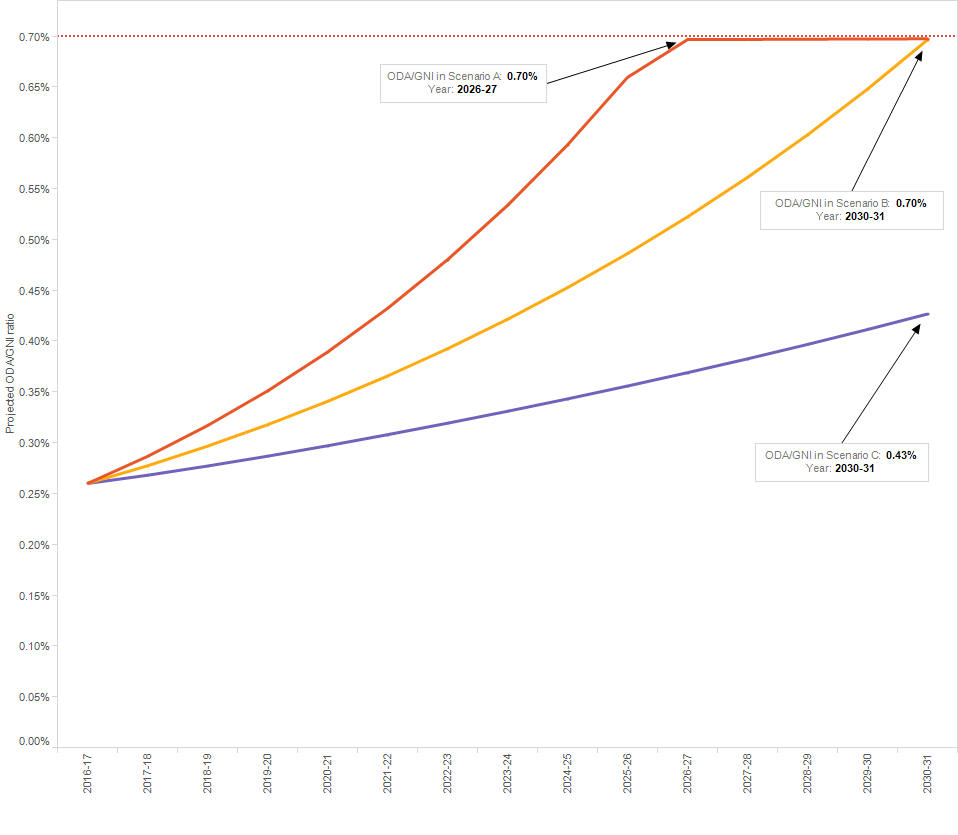
Figure 3. Projected paths for Canada’s ODA/GNI ratio in the three scenarios
Fraser Reilly-King is Senior Policy Analyst with the Canadian Council for International Co-operation.
Aniket Bhushan is Principal, at the Canadian International Development Platform and Adj. Research Professor at the Norman Paterson School of International Affairs.
Please contact aniket@cidpnsi.ca for more information and supporting data.
Recent Comments