
by Aniket Bhushan and Rachael Calleja
Published: March 15, 2017
Global Affairs Canada’s (GAC) Departmental Plans (DP) follow the publication of the Main Estimates which we have analyzed from the perspective of development spending.
The annual Departmental Plan (formerly Report on Plans and Priorities) for the 2017-18 fiscal year outlines GAC’s key priorities, expected results and spending plans over a three-year period.
The DP provides further details and forward projections for GAC’s development policy and spending. The DP confirms findings from our analysis of the Main Estimates (ME) – namely, that GAC’s planned spending for development shows little change.
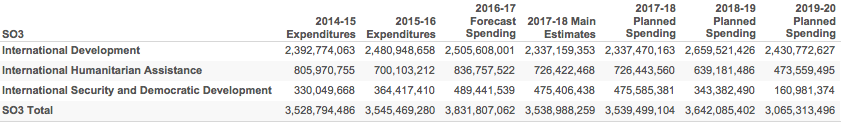
Planned spending for Strategic Objective 3 “International Assistance and Poverty Reduction” is $3.54 billion for the 2017-18 financial year – or, relatively flat compared to past expenditure.
In 2018-19, planned spending is expected to increase slightly to $3.64 billion. This increase will affect the “International Development” sub-program and is driven by funding requirements for the Green Climate Fund (GCF) and Maternal, Newborn and Child Health (MNCH).
By 2019-2020, SO3 spending is expected to decline to $3.07 billion due to sunsetting of funding for GCF, the Peace and Stabilization Operations Program, and humanitarian assistance to address crises in Iraq and Syria.
What does the data show?
Forecast spending for 2016-17 (valued at $3.83 billion) shows an increase over prior years. This temporary ‘bump’ is due to higher than expected spending for “International Security and Democratic Development” and “International Humanitarian Assistance” in the 2016-17 financial year (see below).
The previous year’s plans, i.e. 2016-17 Report on Plans and Priorities (RPP), showed no significant spending increase for the 2016-17 financial year. However, subsequent to the 2016-17 RPPs and ME, the 2016 Budget did add $256 million (over 2 years) to the International Assistance Envelope (IAE). We expect actual spending for the fiscal year about to end will come in higher (as explained in the next section).
Two further points can be noted from the DP:
- Staffing levels are projected to increase: Flat spending is surprisingly met with increased GAC staffing levels. The number of GAC SO3 staff complement (FTE) are projected to increase from 873 in 2015-16 to 1,130 by 2017-18. Most of the new hires are in “International Development”, which gains almost 200 staff, despite little change in spending over the period.
- Results and performance indicators have changed (again) making tracking and analysis over time problematic: Each SO in the DP outlines planned and expected results, with performance indicators and targets. From time to time the department changes these making year on year comparisons (let alone any meaningful analysis) linking spending to targeted results difficult. This particular DP again changes all indicators and targets within SO3 (with the exception of humanitarian assistance – IHA). As a result in most cases past “actual results” from 2013-14 to 2015-16, which might otherwise provide a reference, are left blank. In some cases, e.g. SO3.1 “International Security and Democratic Development”, work is still ongoing to collect baseline information and targets are not yet set.
What about the current, 2016-17, cycle? Supplementary Estimates (C)
In the ongoing i.e. 2016-17 fiscal cycle, which will end on March 31, 2016, Supplementary Estimates are proving particularly significant in the area of development spending.
Supplementary Estimate (C) is the final appropriation bill for the current fiscal. It corresponds to the last parliamentary supply period (ending March 26). Typically, Supplementary Estimates represent requests for spending authority on initiatives that were not sufficiently developed, unknown or further developed since the 2016-17 ME.
The largest percent-wise increase requested in Supplementary Estimate (C) is within the area of international affairs, specifically “global poverty reduction”, up 8%. This represents an increase of $321 million. This is part of, but exceeds, the government’s stated aim to top up the IAE in Budget 2016.
It breaks down as follows:
- IHA (humanitarian), up $165 million or 23%: The money sought by the Government would be used to provide humanitarian assistance to people affected by El Niño, people affected by conflict or disaster, as well as contribute toward international action on antimicrobial resistance.
- International development, up $155 million or 7%: The money requested in these Supplementary Estimates would support various initiatives related to renewable energy in Africa and climate change.
These additions will cause (future) report-able development spending for the current cycle to be higher than may have been estimated at the start of the cycle (as is often the case).
The above could be interpreted as one or a combination of:
- Poor forecasting and planning at the outset of the cycle.
- Significant real unforeseen developments during the course of the cycle (typically emergencies related to natural disasters).
- Late realization of the need to cover expected shortfalls due to a rush to spend to meet commitments not fully provisioned for, only lately developed, or cannot easily be carried forward.
- Window dressing to make the numbers trend a particular way (for a myriad of political and bureaucratic reasons).
In keeping with past trends and patterns
The pattern above should not be surprising. It is (unfortunately) in keeping with past trends. For instance, for “global poverty reduction and international sustainable development”:
- Supplementary Estimate (C) 2015-16: requested a 9.6% increase or additional $328 million. And a 11.7% increase or additional $400 million for “a safe and secure world through international engagement” (which partially relates to the peace and security elements of development spending).
- Supplementary Estimate (C) 2014-15: requested a 3% increase or additional $115 million. But, also a 8% increase or additional $320 million, for “a safe and secure world through international engagement” (which partially relates to the peace and security elements of development spending).
- Each year the reasoning changes – ranging from additional funds for the Stabilization and Reconstruction Task Force (START) in 2014-15, to additional funding for Defense’s work in Ukraine, for the newly constituted “Global Affairs Canada”, and the COP21 commitment to the GCF in 2015-16. But the pattern remains the same.
March madness
This pattern is in keeping with past trends at an even more granular level as we have analyzed in depth.
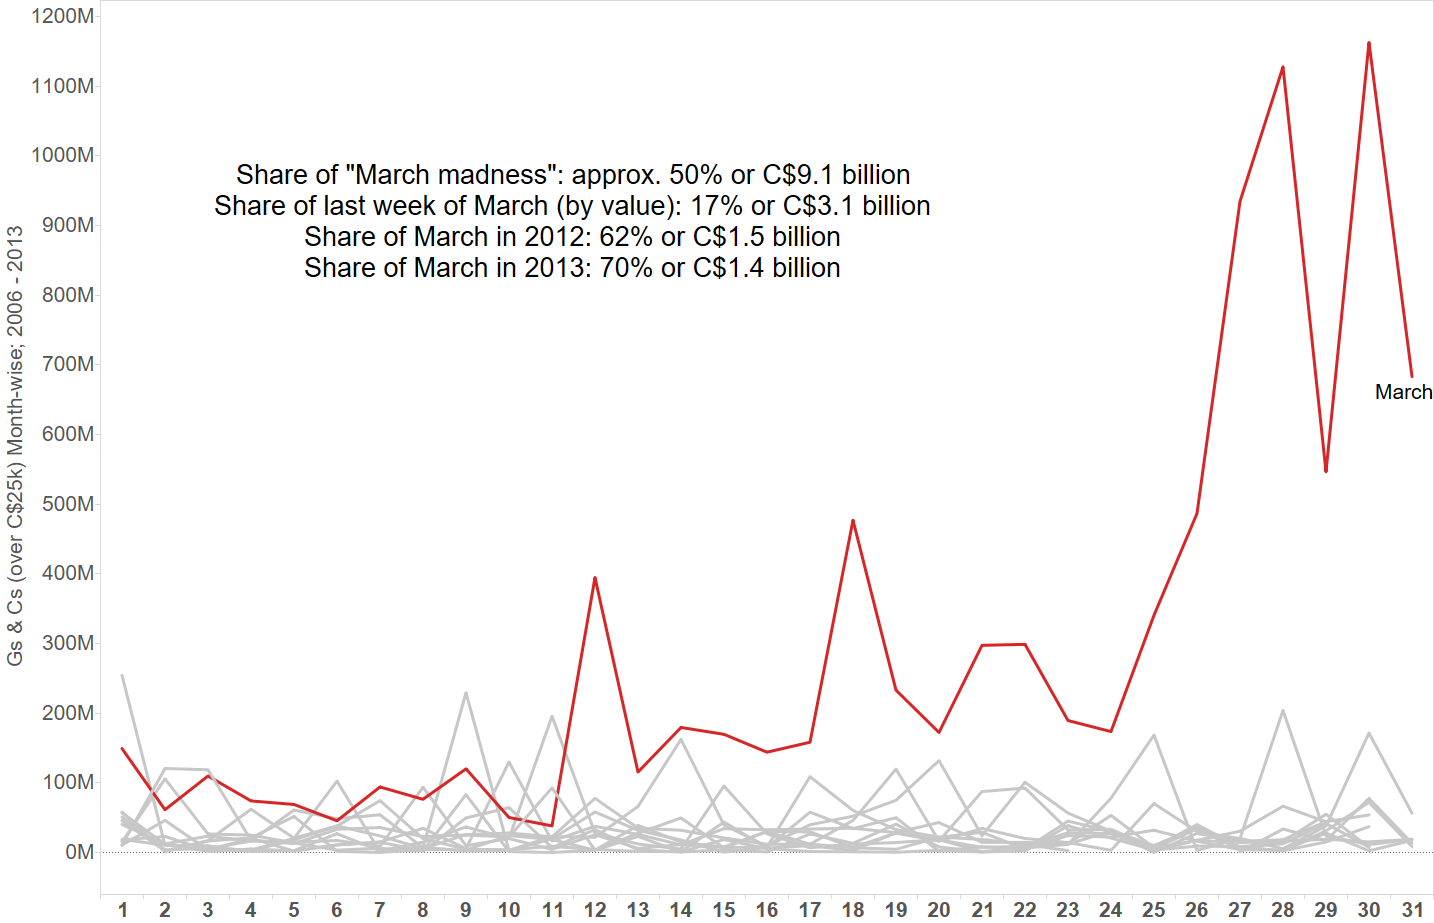
With reference to development spending, the final supply period is often very significant. This is colloquially referred to as “March madness” in development circles. As we have shown, as high as 70% (by value in 2013) of development agreements are signed in the month of March at the very end of the fiscal cycle. In fact a very large share of this is agreed in the last week of March.
The graph below shows the month-wise trend for the period 2006 to 2013, with March highlighted (each of the lines is a month, the x-axis represents dates within each month).
What we are seeing in more recent approvals data
We expect the trend to be similar in the ongoing cycle which completes on March 31, 2017. Watch for future analysis where we will update this picture.
Our work-in-progress analysis shows that:
- Total development grants and contributions (GCs) commitments approvals ramped up significantly: 2014-15 was 63% higher (by amount) than the previous year and 2015-16 was 14% higher than the previous year. But there are some good reasons for this:
- Exceptional payments to the World Bank; large multi-year awards for the Global Fund (2014-15 to 2017-18); for GAVI (2016-2020); NATO’s Afghan Army Trust Fund (2016-17 to 2018-19); as well as UNOCHA, WFP, UNDP.
- As well as large multi-year awards to Canadian organizations, for e.g. Grand Challenge Canada (2015-16 to 2024-25); Canadian Foodgrains Bank (2016 to 2020); Micronutrient Initiative (2015 to 2020).
- The above account for over a quarter of the awards approved over the two cycles discussed.
- When viewed by date of agreement they have the effect of making the current value look high, when in fact they are over time and may not be repeated (in the same way) in future cycles. It so happens that a number of these took place during the course of the last two cycles.
- In the 2014-15 fiscal, March accounted for 37% of award approvals (by value).
- In the 2015-16 fiscal, March accounted for 22% of award approvals (by value).
Recent Comments