
Published September 6, 2018 (updated Sept 19, 2018)
By Lance Hadley and Bridget Steele
On May 31, 2018, President Trump issued two Presidential Proclamations placing iron and steel, and aluminum tariffs on Canadian exports. A 25% import tariff was applied to Canadian iron and steel and a 10% import tariff was applied to aluminum. In this report we analyze recently released monthly Canadian International Merchandise Trade data to identify the impact of these tariffs on the month-on-month change of Canadian iron and steel, and aluminum exports to the United States.
Main Findings
Our key finding is that the May 31st, 2018 tariffs have had and are having a clear, discernible and statistically significant depressive effect on Canadian iron and steel, and aluminium exports to the US. Furthermore, our findings suggest the following:
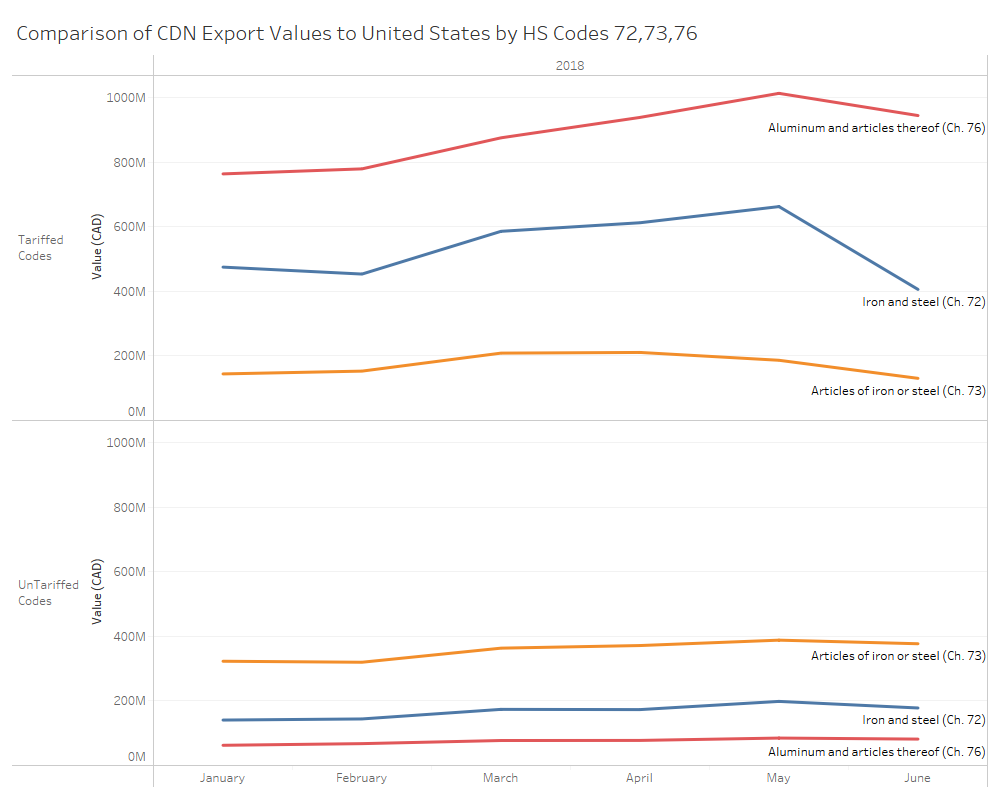
- The total export value of iron, steel, and aluminum (HS chapters 72,73,76) to the United States declined CAD$416 million from CAD$2.5 billion in May 2018 to CAD$2.1 billion in June 2018. The largest source of this decline comes from tariffed goods. The sum of tariffed HS codes declined by 22% (CAD$1.8 billion in May 2018 and CAD$1.4 billion in June 2018). The sum of untariffed iron, steel, and aluminum HS codes had a comparatively smaller decline from CAD$672 million in May 2018 to CAD$637 million in June 2018 (a 5% decline).
- In June 2018, the export value for each tariffed HS code to the United States dropped on average -21% from the previous month.
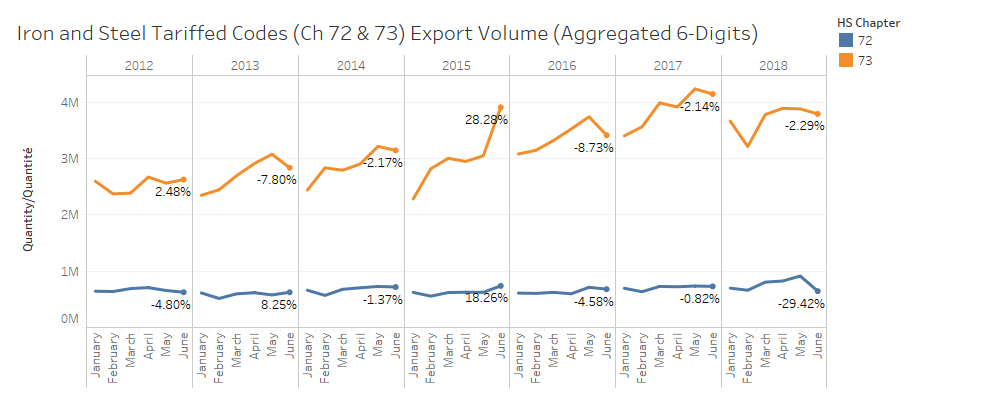
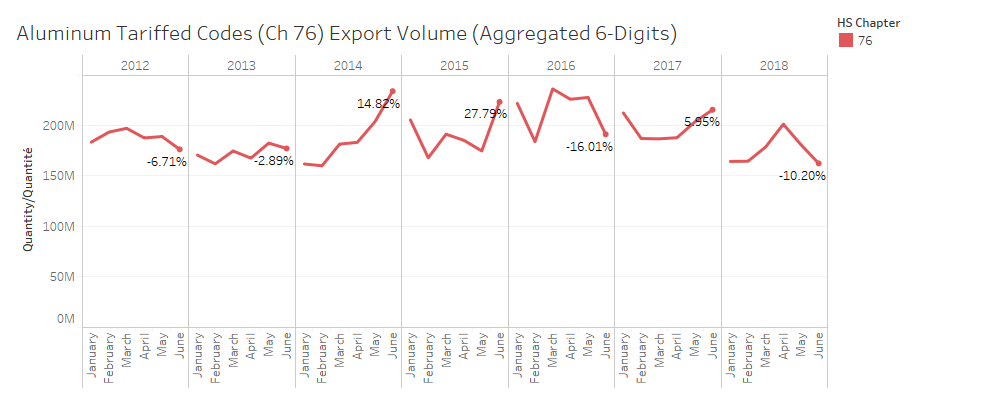
- This effect is consistent across Canadian export volumes to the United States for tariffed products. For tariffed aluminum products, there was an average -14.5% month-on-month decline in export volumes between May 2018 (pre-tariffs) and June 2018 (post-tariffs). For iron and steel export volumes, each tariffed HS code declined by an average -35.2% for the same period.
- Preliminary trade data July 2018 suggests that tariffs are having a sustained effect on these products, which have yet to return to May’s pre-tariff levels.
The chart below shows the sum of 6-digit HS codes at the HS Chapter level for tariffed and non-tariffed goods.
We conducted statistical mean-comparison analyses to test for historical seasonality, possible speculation (a buy up of products before tariffs were applied), and possible exchange rate effects. The charts below visualize the month-on-month changes in volume at the HS Chapter level for tariffed goods every year from 2012-2018.
While there have been declines in prior years, the graphs in addition to the statistical analyses (t-tests) substantiate our finding that the 2018 tariffs had a statistically significant depressive effect on Canadian iron and steel, and aluminium exports to the US. June 2018’s month-on-month percentage decline in both the value and volume of Canadian exports to the US cannot be attributed to historical patterns, speculation or exchange rate effects (all of which were tested for robustness).
Method
Research Question: What impact did President Trump’s May 31st tariffs have on the month-on-month change of Canadian iron and steel, and aluminum exports to the United States?
- Data from the Canadian International Merchandise Trade Database is filtered for the following months: January 2012 through to June 2018 inclusive.
- The unit of observation is the month-on-month percentage change for each of the six-digit HS codes named in President Trump’s Proclamation. E.g. if May 2018 HS code 7216.50 was $50 and in June 2018 it was $60, this is recorded as a 20% month-on-month percentage change. HS codes were unweighted and uncompressed. Data is available for download at the bottom of this page.
- The sample is comprised of the month-on-month percentage changes of Canadian exports and re-exports to the United States for HS chapters 72 (Iron and steel), 73 (Articles of iron or steel), and 76 (Aluminum and articles thereof).
- Based on the HS2017 six-digit nomenclature, this yields a potential 191 rows per month. Sample sizes are presented for each t-test in our findings. In our t-tests HS codes with null month-on-month percentage changes are removed, yielding about 140 comparative observations per t-test.
- A series of t-tests using month-on-month percentage changes in exports, paired by six-digit HS codes named in President Trump’s Proclamation, was conducted to analyze the significance of the change in export growth (before and after the tariffs were implemented).
- President Trump’s Proclamation states, “steel articles” are defined as having the Harmonized Tariff Schedule (HTS) 6‑digit level as: 7206.10 through 7216.50, 7216.99 through 7301.10, 7302.10, 7302.40 through 7302.90, and 7304.10 through 7306.90. “Aluminum articles” are defined as falling under HTS headings for 7601; 7604; 7605; 7606; 7607; 7608; 7609; 7616.99.51.60; and 7616.99.51.70.
- Primary findings are derived from a paired mean-comparison t-test of June 2018’s 6-digit HS codes month-on-month percentage changes and May 2018’s 6-digit HS codes month-on-month percentage changes.
- To check for seasonal effects the month-on-month percentage change of tariffed exports in June 2018 were compared to the month-on-month percentage change of tariffed exports in June of the following previous years: 2012, 2013, 2014, 2015, 2016, and 2017.
- To account for an assumed speculation and increase in export value in the month leading up to the tariff implementation, the June month-on-month percentage change was compared against the following month-on-month percentage changes: January 2018; February 2018; March 2018; and April 2018.
- To check if June’s 2018 month-on-month percentage change is significantly different than the month-on-month percentage change distribution for the previous six years (where no tariffs were implemented), an unpaired t-test compares the samples of June 2018’s month-on-month percentage change to every other month-on-month percentage change in the data sample (January 2012-June 2018).
Results
- Canada’s June 2018’s tariffed iron and steel and aluminum exports showed a statistically significant month-on-month percentage decline when compared to May 2018.
- The difference in export month-on-month percentage change for tariffed HS codes between May and June is statistically significant (t = -3.03). The average mean for May’s export month-on-month percentage change was 0.97%. June’s average month-on-month percentage change was -.35%.
- The difference in export growth rates for non-tariffed steel, iron, and aluminum exports of the two monthly samples were not statistically significant (t = 1.1722).
- The statistical significance of the decline in month-on-month percentage changes holds when preliminary data from July 2018 is compared to May 2018 suggesting that tariffs are having a sustained effect.
| Sample 1 | Sample 2 | T-tests (Export Value) | T-tests (Export Volume) |
| June 2018 (tariffed HS codes) | May 2018 (tariffed HS codes) | -3.0259*** (n=140) |
-8.2344*** (n=154) |
| June 2018 (non-tariffed HS codes) | May 2018 (non-tariffed HS codes) | 1.1722 (n=141) |
-1.1795 (n=65) |
| Note: Sample size of t-test given in brackets; * p<0.05; ** p<0.01; ***p<0.001 | |||
- The month-on-month percentage decline in tariffed iron and steel, and aluminum exports for June 2018 was not due to speculative growth in the months leading up to the implementation.
- Speculation could explain the difference of month-on-month percentage change in June 2018 compared to other previous months in 2018 and in previous years. If companies anticipated the tariffs they may have tried to export more goods in May than in a typical month to avoid having to pay tariffs in the month of June – inflating pre-June export month-on-month percentage changes.
- However, when the June 2018 month-on-month percentage change of tariffed exports was compared against months previous to May the significance was maintained.
| Sample 1 | Sample 2 | T-tests (Export Value) | T-tests (Export Volume) |
| June 2018 | Jan 2018 | -5.1866*** (n = 141) |
-4.3516*** (n = 154) |
| June 2018 | Feb 2018 | -4.1488*** (n = 142) |
-4.3112*** (n = 152) |
| June 2018 | Mar 2018 | -2.7101*** (n = 140) |
-3.6985*** (n = 155) |
| June 2018 | April 2018 | -3.2678*** (n = 144) |
-5.8572*** (n = 152) |
| Note: Sample size of t-test given in brackets; * p<0.05; ** p<0.01; ***p<0.001 | |||
- The decline in month-on-month percentage change for tariffed iron and steel, and aluminum exports for June 2018 was not a seasonal effect.
- The difference in the month-on-month percentage change of tariffed exports in June 2018 is statistically significant compared to the June month-on-month percentage change for the same HS codes for the years 2012-2018.
| Sample 1 | Sample 2 | T-tests (Export Value) | T-tests (Export Volume) |
| June 2018 | June 2012 | -1.8208* (n=134) |
-2.5123* (n=150) |
| June 2018 | June 2013 | -4.4094*** (n=133) |
-2.0150* (n=147) |
| June 2018 | June 2014 | -3.6679*** (n=138) |
-3.2549** (n=151) |
| June 2018 | June 2015 | -3.4592*** (n=137) |
-3.6432*** (n=148) |
| June 2018 | June 2016 | -1.3484 (n=142) |
-2.8502** (n=147) |
| June 2018 | June 2017 | -3.5625*** (n=144) |
-5.3164*** (n=153) |
| Note: Sample size of t-test given in brackets; * p<0.05; ** p<0.01; ***p<0.001. | |||
- The June 2018’s decline in month-on-month percentage change for tariffed iron and steel, and aluminum exports is slightly outside the norm of month-on-month percentage changes over the last 6 years.
- To further test the exogenous influence of tariffs on June’s month-on-month percentage change, every month-on-month percentage change among tariffed codes for the previous six years (where no tariffs were implemented) was compared against June’s monthly month-on-month percentage change.
- An unpaired mean-comparison test of the month-on-month percentage change of tariffed HS codes in June 2018 and the month-on-month percentage change for tariffed HS codes for each month between January 2012 and May 2018 gives a t-test score of -1.5861. While very slightly below the 95% statistical threshold, this result shows that June 2018’s month-on-month percentage change for tariffed HS codes were beyond the normal distribution of month-on-month percentage changes for the last 6 years.
| Sample 1 | Sample 2 | T-test (Export Value) | T-test (Export Volume) |
| June 2018 month-on-month percentage change (export value, n=148; export volume n=157) |
Month-on-month percentage changes for 2012-01 to 2018-05 (export value n= 11,061; export volume n=12,749) |
t = -1.5861 (p=0.0564) |
t = -2.6210** (p=0.0088) |
| Note: Size of unpaired samples in brackets. | |||
Conclusion
President Trump’s May 31st tariffs have had a statistically significant depressive effect on Canadian iron and steel, and aluminum exports to the United States. The precise export value of trade lost because of these tariffs is difficult to calculate. However, back-of-the-envelope calculations suggest that if pre-tariff historical trends held, the value of Canadian iron and steel, and aluminium exports to the US would be approx. CAD$600M higher than they were post-tariff in June 2018. In other words, our estimate for the loss in Canadian exports in the month of June alone (i.e. the first month of the tariff) is approx. CAD$600M.
Preliminary CIMT data for July 2018 suggest that exports have not fully recovered to pre-tariff levels, which implies these tariffs will have a longer-term affect on Canada’s iron and steel, and aluminum exports.
Canada retaliated against Trump’s tariffs by imposing counter tariffs on certain US-origin goods. Canada imposed surtaxes of either 25% or 10% depending on the good, against CAD$16.6 billion in imports of iron and steel, aluminum, and other products from the US. These countermeasures took effect on July 1, 2018 and are expected to remain in place until the US eliminates its trade-restrictive measures against Canada. As further trade data are released, CIDP expects to monitor the effects of Canadian tariffs on US products and assess whether Canadian tariffs are as damaging to US exports as Trump’s tariffs have been to Canadian exports.
Recent Comments